


Talking Points
-3 different wave counts suggest a bounce of at least 150 pips
-A break below 1.0800 likely accelerates to below 1.05
-Look for short opportunities below 1.0800 or bounces to 1.1050-1.1300
Earlier today, the Fed released their statement regarding their monetary policy outlook and it created a knee jerk reaction in forex towards buying US Dollars. The subsequent move in the EUR/USD stopped at an important inflection point which could open the door to a counter trend rally higher. Though EUR/USD liquidity is typically thinner through the US afternoon session, we will get a better sense of any potential follow through Thursday morning when London arrives.
In this article, we will look at the EURUSD technical picture through the lens of Elliott Wave. In a moment, we’ll share a preferred wave count and a couple of alternatives. We never know for sure what the wave count is until the waves are finished. Therefore, we need to bring a probabilistic approach in what is likely to happen based on the patterns.
The patterns we’re looking at suggests a higher likelihood that the EURUSD finds support in the 1.0850-1.0900 price zone. That may lead to a rally of at least 150 pips.
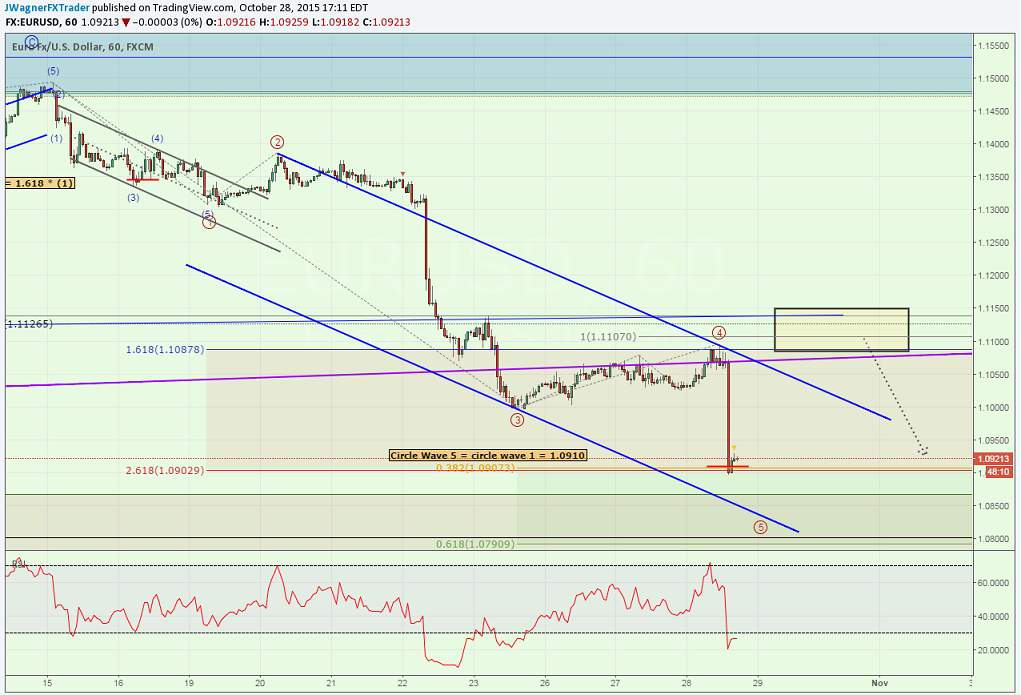
The preferred Elliott Wave count we are considering is that today’s low is the end of the 1st wave of a medium term sell off. We can see this October 15 to October 28 sell off subdivide into 5 waves. Once we anticipate the end of wave 4 (which occurred this morning), we can estimate the termination point of the 5th and final wave of that sequence.
Circle wave 5 = circle wave 1 = 1.0910
Circle wave 5 = .382 * circle wave 1 through 3 = 1.0907
As you can see, this created a tight cluster around 1.0900.
Additionally, one alternate count that we’re watching (not shown) is that today’s low is actually circle wave 3. Alternating waves typically have a Fibonacci or equality relationship. In this case, circle wave 3 would be equal to 2.618 * circle wave 1 near 1.0903.
Lastly, secondary alternate count is that this October 15 to October 28 sell off would be the alternative wave to the August 24 to September 3 sell off (not shown). Alternating waves often times have an equality measurement which means the second sell off (October) would equal the first (August – September) in distance near 1.0867.
Suggested Reading: How to Use Alternating Waves in a Forex Strategy
Conclusion
Bottom line, between 1.08-1.09, there is a high likelihood of a bounce forming in the EUR-USD that could spring higher to 1.1050-1.1300. A break below 1.0800 would alleviate pressure on this bounce and likely continue to below 1.05.
Though a bounce may develop, the trend is still down so we will use the bounce to short at higher price levels.
---Written by Jeremy Wagner, Head Trading Instructor, DailyFX EDU
Follow me on Twitter at @JWagnerFXTrader .
See Jeremy’s recent articles at his Bio Page.
Do you know the biggest mistake traders make? More importantly, do you know how to overcome the biggest mistake? Read page 8 of the Traits of Successful Traders Guide to find out [free registration required].
To receive additional articles from Jeremy via email, join Jeremy’s distribution list.


