


Article Summary: One forex strategy many traders use is a technical analysis strategy of comparing the length of two alternating waves. Many times, these waves are related in distance by Fibonacci ratios. This is the first of a multi-part series for projecting wave extensions using the Fibonacci expansion tool.
The Fibonacci sequence provides the foundation of trading decisions for many traders through the golden ratio. This is the first part of a multi-piece sequence on trading with Fibonacci ratios in determining price projections.
Fibonacci can be a complicated subject because there are a wide variety of uses and interpretations for it. My objective of the first part of this series is to focus using Fibonacci in alternating waves. Future articles will use the length of alternating waves to aid us in determining entry and exit points of a pair.
To get started, it is important to understand some common wave relationships between the alternating waves. For those who follow Elliott Wave Theory, you may find some of this familiar and a good refresher.
What are Alternating Waves?
In a three wave move, the alternating waves will be wave A and wave C (or if you label with numbers, wave 1 and wave 3). So, in the picture below of an uptrend, the alternating waves are the first wave of the uptrend and the 2nd leg of the uptrend which happens to be the C leg of the pattern (the waves colored in blue).
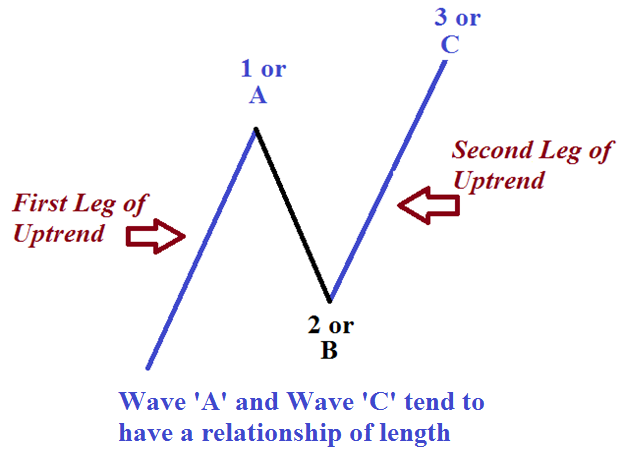
So when referencing alternating waves, we are referring to waves ‘1’ and ‘3’ or waves ‘A’ and ‘C’.
What are the common wave relationships?
There are many ratios that traders use. We will try to keep things simple and focus only on patterns showing a .618, 1.00, 1.618 or 2.618 relationship.
These ratios are derived from the Fibonacci number sequence. The Fibonacci sequence is a numerical series where every number is the sum of the preceding two numbers. Here is an example of the first several Fibonacci numbers:
1, 1, 2, 3, 5, 8, 13, 21, 34, 55, 89, 144, etc
The ratios mentioned at the beginning of this section are obtained by manipulating the numbers in this sequence.
.618 = Take any number of the sequence and divide it by the number to the right. As this sequence becomes larger, this ratio closes in to .618.
1.618 = Take any number of the sequence and divide it by the number to the left. This ratio closes in on 1.618 as the sequence becomes larger.
2.618 = Take any number of the sequence and divide it by the number 2 positions to the left. This ratio closes in to 2.618 as the sequence becomes larger.
Where is the 1.00 description?
You may have noticed that the 1.00 description was not provided above. The 1.00 is not a part of the Fibonacci sequence (unless you want to get cute and take a number and divide it by itself). However, this 1.00 figure is very important when assessing alternating waves. A relationship of 1.00 means the alternating waves are equal in length, which is a common wave relationship.
So, if the wave ‘C’ is approaching the 1.00 wave relationship, the 1.00 levels represents the price point where the length of wave ‘A’ is equal to the length of wave ‘C’.
How do I find and draw the Fibonacci levels on the charts?
First, assess the direction of the trend. If the trend is up, we want to look for an up-down sequence to draw the Fibonacci levels on the chart. (This would represent waves A and B of the 3 wave move.)

Then, when prices retrace only a portion of the first up leg, this leaves the pair exposed to an upside break to new highs. Therefore, this partial retracement of the up leg becomes the ‘B’ leg of the three wave pattern. We will use the first two waves to estimate potential stopping points for the 3rd leg of the pattern.
If these potential price projections are near other levels of resistance, then we can build confidence in establishing short positions at the resistance zone.We can use the alternating wave relationships to pinpoint potential reversal points. Above, we can see how wave ‘C’ comes very close to reaching the 1.00 (which is the 100%) level then reverses. This means that wave ‘C’ was about the same length of wave ‘A’ which is common in a three wave movement.
Additional Reading: Timing Reversals with Equal Waves (Part 2)
---Written by Jeremy Wagner, CEWA-M, Head Trading Instructor, DailyFX Education
Follow me on Twitter at @JWagnerFXTrader.
To be added to Jeremy’s e-mail distribution list, click HERE and enter in your email information.
Are you new to FX trading? We created this guide just for you.


