The BIG Idea on Being Bullish Cable ( GBP/USD :)
A momentum shift may be in play that could favor significant sterling strength.
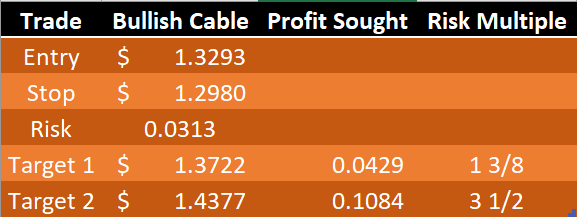
- Point to Establish Long Exposure: Break & close above corrective triangle: $1.3293
- Spot: $1.2983 per GBP
- Target 1: $1.3722 per GBP (61.8% retracement of 2018 range,) > 1:1 Risk: Reward Ratio
- Target 2: $1.4377 per GBP (High of 2017 Range,)1:3 Risk: Reward Ratio
- Invalidation Level: $1.2980 per GBP (50% retracement of recent bounce,) 313 pip stop
Our Q4 Currency Forecasts are fresh, grab them for FREE here
Trade Structure with Entry Order

The BIG Picture on Bullish GBP/USD :

Chart Source: Pro Real Time with IG UK Price Feed. Created by Tyler Yell, CMT
What Are the Charts Saying to Support This Trade?
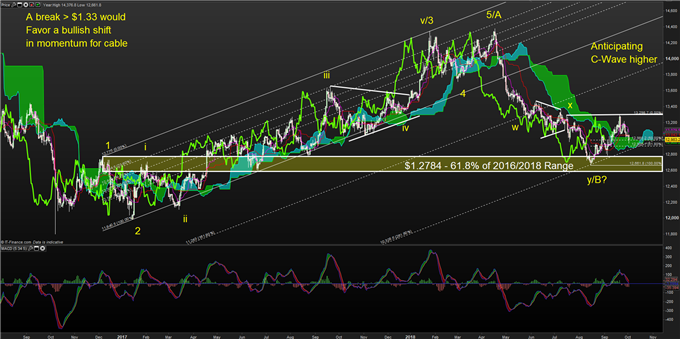
The chart above is busy, but the key takeaway is that after a massive surge of USD strength (price lower on the chart above,) we’ve seen the first inclination of a shift back toward the 2017 trend.
The chart above has a handful of indicators, so let’s walk through them to discuss what they may be saying. First, and foremost, Ichimoku cloud is showing the potential workings of a bullish reversal, which this trade idea is predicated upon as price broke above the cloud. The key factor missing here is the lagging ling also being above the cloud on the daily chart.
Helping to support this view that we could see a bullish breakout in cable is MACD (5,34,5.) The adjusted settings show bullish divergence and a recent move into positive territory, which means the recent move higher to $1.3298 may have follow through, which this trade depends on if it is to work.
What is great (to me) about this chart is that a breakout of momentum via the lagging line would happen on a resurgence in the price above $1.3293, which is five pips below the recent peak and also above the triangular correction that terminated in mid-July as this move lower was in full swing.
Precisely a month later, the trend reversed higher, and it did so near the 61.8% retracement of the 2016-2018 range of $1.18-$1.4376. The 61.8% retracement is important in the world of Elliott Wave Theory, which the labels above correspond to applying. If B-wave is over, we should see a C-wave that meets or possibly exceeds the end of A at $1.4376 if this count/ interpretation is correct.
The last tool on the chart is the Fibonacci Channel, which was drawn off the peaks of wave 1 and 3, and extended from the base of wave 2. The extensions show that the retracement to $1.2661 may have aligned with a Fibonacci extension of 261.8%. Of the reasons for this trade to work out, this holds the least weight, but should still be added to the evidence especially if this trade is triggered.
Piecing Together the Developments That Could Support This Trade
In the article, 2.5 Reasons to Be Bullish GBP/JPY with A Focus on a Break above 147, I argued that Brexit would continue to add volatility to the picture, and our recent Q4 forecast on the British Pound says much the same.
Recently, the collision of data and politics seem to favor the US Dollar. As the US Dollar weakened in September, the recent bounce keeps traders doubting as some of the moves looks to be supported by a short-term phenomenon in interbank borrowing markets (cross-currency basis swaps) that showed US Dollar demand increased aggressively to cover hedging for the end of Q4.
Traders understandable see the Fed as the most hawkish central bank on the global playground, but at the same time, every hike takes us closer to cycle’s end, and institutional positioning is at extremes in favor of the USD so a shift could take it aggressively lower.
DFX Trading Resources to Support Your Strategy
DailyFX offers a surplus of helpful trading tools, indicators, and resources to help traders. For those looking for trading ideas, our IG Client Sentiment shows the positioning of retail traders with actual live trades and positions.
Our trading guides bring our DailyFX Quarterly Forecasts and our Top Trading Opportunities, and our real-time news feed has intra-day interactions from the DailyFX team. And if you’re looking for real-time analysis, our DailyFX Webinars offer numerous sessions each week in which you can see how and why we’re looking at what we’re watching.
If you’re looking for educational information, our New to FX guide is there to help new(er) traders while our Traits of Successful Traders research is built to help sharpen the skill set by focusing on risk and trade management.
---Written by Tyler Yell, CMT
Tyler Yell is a Chartered Market Technician. Tyler provides Technical analysis that is powered by fundamental factors on key markets as well as trading educational resources. Read more of Tyler’s Technical reports via his bio page.
Talk markets on twitter @ForexYell


