NZDUSD Trade Setup Talking Points:
- NZDUSD tiptoes above its 100- and 200-day moving averages, and may look to test longer-term support
- The week ahead presents ample opportunities to spark risk aversion
- A break below support from October and the moving averages would likely spur a deeper sell-off
NZDUSD Appears Vulnerable Near Critical Support
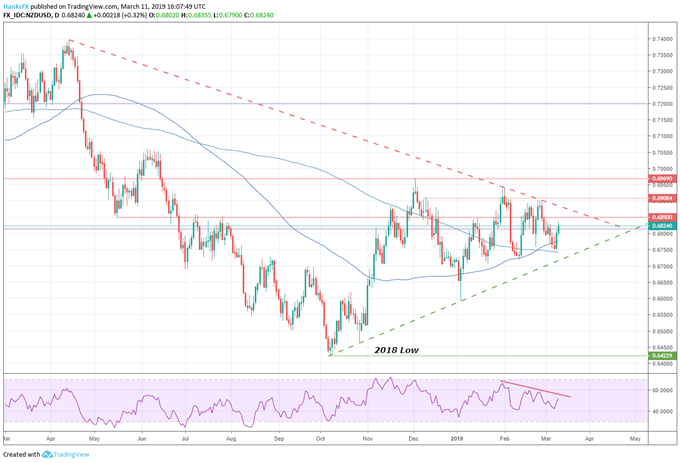
NZDUSD looks threatened this week as the pair treads water above support stretching back to October 2018. The trendline has held its ground since its inception and during the USDJPY flash crash. Still, the pair appears weak given the long-term downward trend from April 2018 to the topside. With the pair seemingly caught between a tale of two trends, broader-market risk aversion may see topside resistance win out.
NZDUSD Price Chart: Daily Time Frame (February 2018 – March 2019) (Chart 1)

Given the high levels of event risk in the week ahead, a return to the risk-averse mood experienced last week is well within reason. Should risk aversion reappear, the typically risk-on NZD may find itself pressured versus its USD counterpart which is oft regarded as a safe haven currency. Together, the technical and fundamental landscape appear skewed to the downside.
Price Levels to Watch
With that in mind, a breakthrough of the resistance trendline from April would effectively invalidate this trade setup as it is largely predicated on the strength of the longer-term trend. That said, minor resistance lies between the spot price at the time of this article’s publication and the April trendline at 0.6850. The area has provided moderate resistance in the past and marks May 2018’s swing low.
Improve your trading with “Traits of Successful Traders – Number One Mistake Traders Make.”
To the downside, the most notable level is the October trendline. A break below this level would likely open up further selling to the 0.6590 area which marked the bottom of the USDJPY flash crash. Apart from the October trendline, support is present nearby with the 100- and 200-day moving averages. A brief break below these indicators last week suggest downside pressure has been mounting. A close below either of the indicators, or both, would constitute further bearish bias.
As the pair approaches the confluence of the two longer-term trendlines, NZDUSD will likely await a fundamental spark. A Brexit breakdown or US equity weakness could deliver one. In the meantime, follow me on Twitter @PeterHanksFX for commentary and updates on this trade.
Read more: USD/CAD Risks Larger Pullback as Post-BoC Rally Stalls, RSI Flops
--Written by Peter Hanks, Junior Analyst for DailyFX.com
Contact and follow Peter on Twitter @PeterHanksFX
DailyFX forecasts on a variety of currencies such as the US Dollar or the Yen are available from the DailyFX Trading Guides page. If you’re looking to improve your trading approach, check out Traits of Successful Traders. And if you’re looking for an introductory primer to the Forex market, check out our New to FX Guide.


