


US Dollar, EUR/USD, GBP/USD, AUD/USD, USD/CAD Talking Points:
- It’s a busy week for the US Dollar with FOMC minutes set to be released on Wednesday and the Non-farm Payrolls report coming out on Friday.
- The USD has been range-bound for six weeks now but has so far started 2022 on a bullish note, breaking above a falling wedge formation that had built inside of the longer-term range.
- The analysis contained in article relies on price action and chart formations. To learn more about price action or chart patterns, check out our DailyFX Education section.

Welcome to 2022. The year has so far started briskly for the US Dollar with the currency putting in a quick pop to begin 2022 trade. Taking a step back, the USD does remain in a range and that’s been the case since late-November.
Support at 95.52 traded just after Black Friday, when news of the Omicron variant unsettled markets temporarily. And at resistance, we have a spot at 96.94 that was nearly broken on December 15th, the day of the last FOMC rate decision. After threatening a topside break prices quickly retreated back to support, with the 95.86 Fibonacci level playing a large role in that outlay along with 96.47 helping on the side of resistance.
That latter price was the final target in the Q4 technical forecast and we’ve now issued fresh quarterly forecasts for Q1, 2022. I remain bullish on the currency and if you’d like to read the full write-up, the link below will allow you to access the Q1 Forecast for the US Dollar.

US Dollar Daily Price Chart
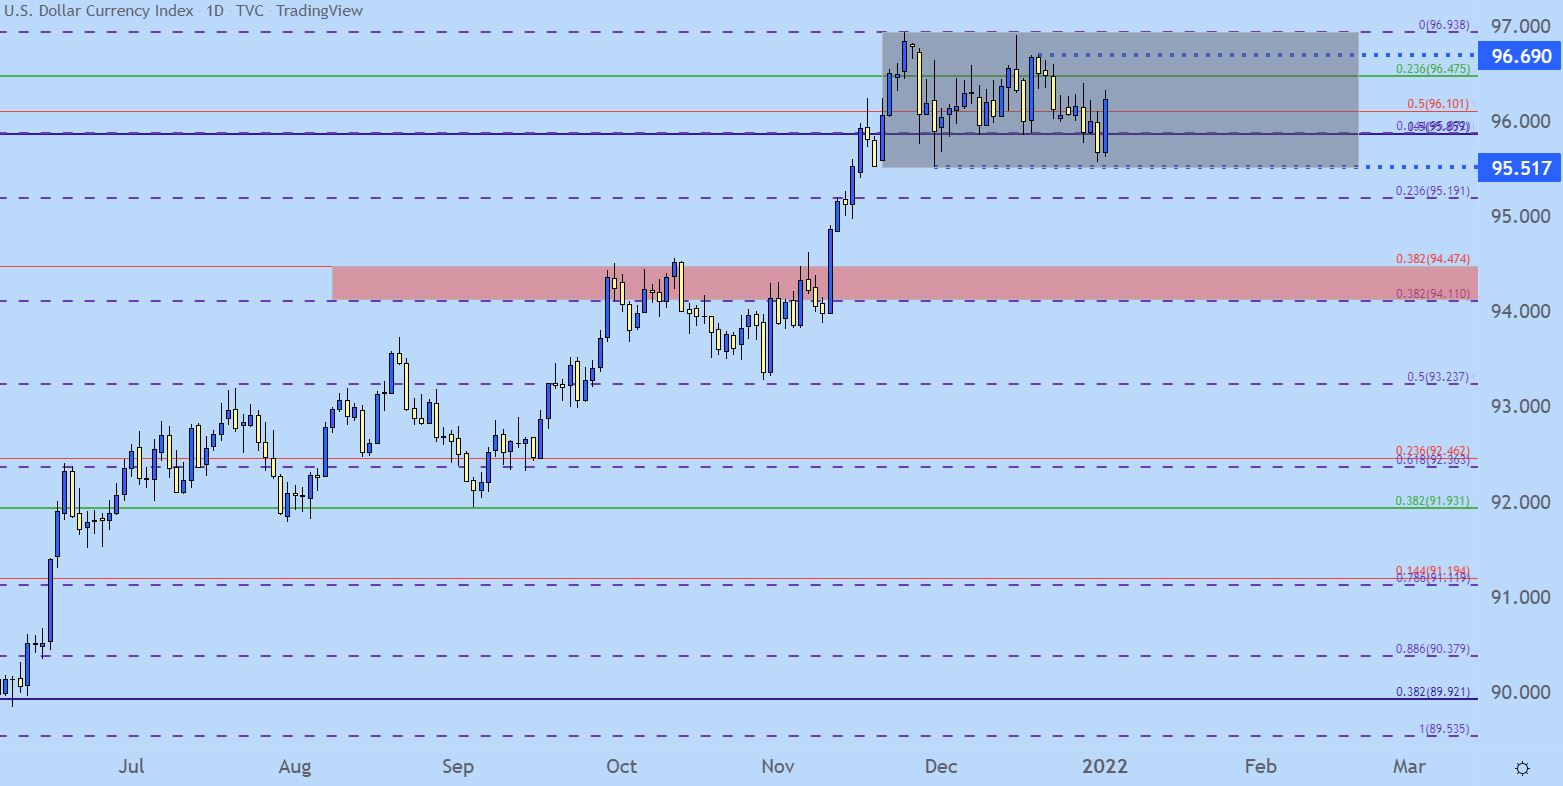
Chart prepared by James Stanley; USD, DXY on Tradingview
USD Shorter-Term: Jump to Start 2022 Trade
After languishing near range support to end last year, the US Dollar has started 2022 on a strong note. The currency had built a falling wedge formation inside of the longer-term range, and that formation began to give this morning as buyers pressed prices-higher. The next major waypoint on the Fibonacci level at 96.47, after which 96.69 comes into the picture.
US Dollar Four-Hour Price Chart

Chart prepared by James Stanley; USD, DXY on Tradingview
EUR/USD Range Remains but Can Bears Push to Support?
It’s been especially quiet in EUR/USD since the Thanksgiving holiday, and this covers the December FOMC rate decision as well as the ECB rate decision that took place last month. Through it all, 1.1375 remains as resistance.
A bearish push sparked this morning and, at this point, there’s potential for today’s candle to close as a bearish engulf, which could keep the door open for short-side momentum scenarios down into the 1.1187-1.1212 zone of support. That zone marks last year’s low and it was also the low in June of 2020, making for an especially sticky area on the chart.
The big question is whether sellers can put in another test here as the past test in late-November was very short-livid. That’s when news of the Omicron variant began to spread and this created a noticeable risk-off move across global markets, including that punch to the USD that pushed DXY down to a 95.52 low.
On the resistance side of the pair, a big zone looms above from 1.1448-1.1500, and if buyers do prevail in taking out the 1.1375 level, deeper resistance can be sought out in this secondary zone.
EUR/USD Daily Price Chart

Chart prepared by James Stanley; EURUSD on Tradingview
GBP/USD Springs Back to Life After Test of Significant Support
The Bank of England hiked rates in December and there’s already expectation for more. Ahead of the move, the British Pound was abysmally weak, and as I had shared, both GBP/USD and GBP/JPY were testing significant areas of support on the chart.
Since that rate hike, GBP/USD has sprung back to life and has even challenged the 1.3500 psychological level. The longer-term bull flag formation remains in-play, with the topside of the formation currently projecting to around 1.3625.
This could make GBP/USD as one of the more attractive short-USD scenarios, and in the event that the USD tips below that range support looked at above, there’s the possibility of a bull flag break coupled with bullish continuation scenarios. The 38.2% retracement of the 2020-2021 move has helped to cauterize support, and the next level from that retracement is the 23.6% marker at 3581, after which the 14.4% marker plots around 1.3842, which is confluent with the current three-month-high in the pair.
GBP/USD Daily Price Chart
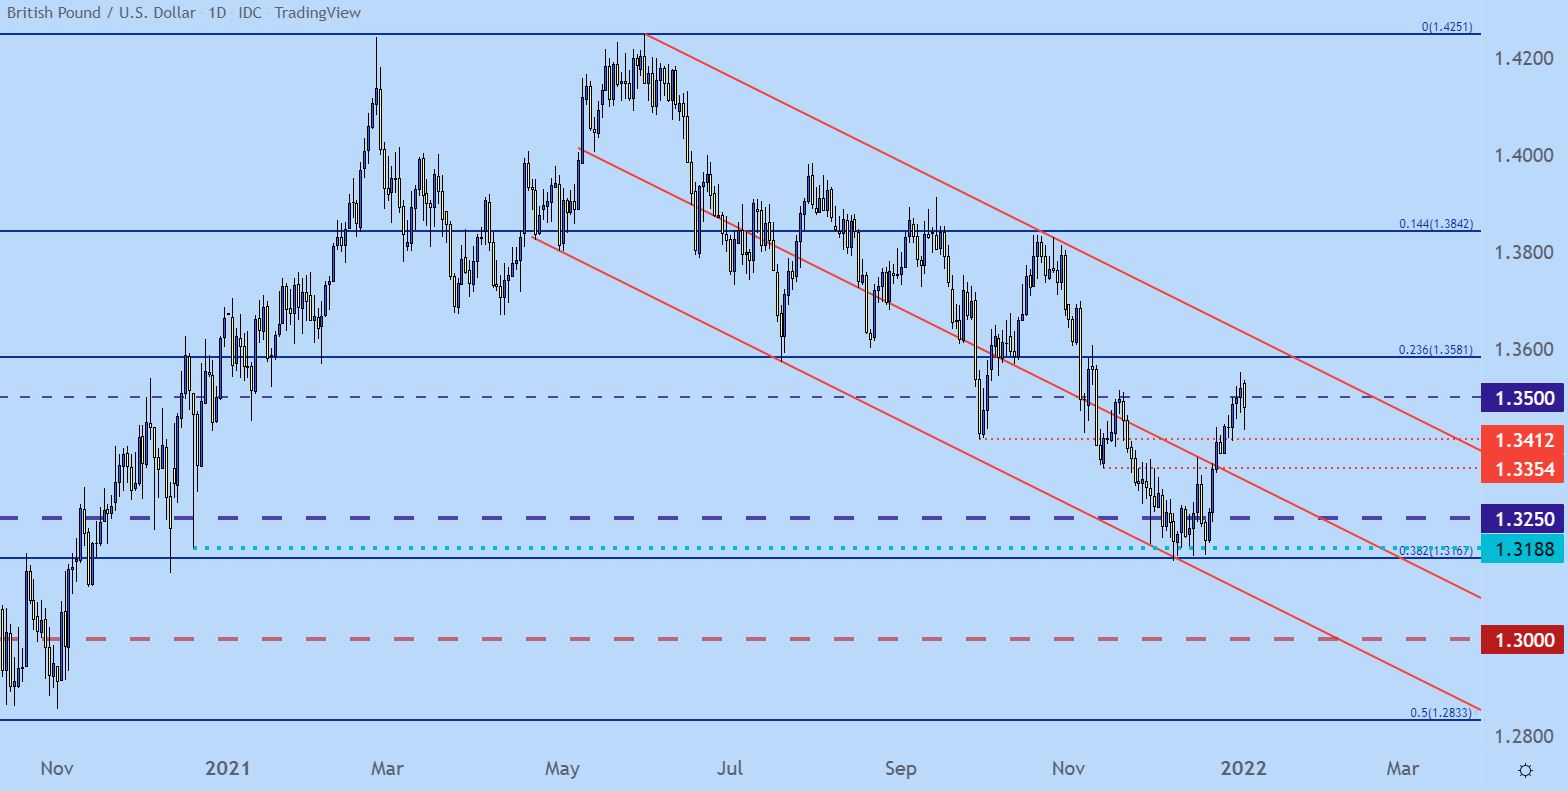
Chart prepared by James Stanley; GBPUSD on Tradingview
USD/CAD 1.3000 Awaits
I had written about the Canadian Dollar a little earlier today but USD/CAD remains pertinent to USD strategy so I’ve included it here.
Late December trade worked out well in the pair as prices pushed up for a test of the same 1.2950 level that had set the high in August. I had highlighted this move just ahead of the break, as prices were back at the 2850 level finding resistance again.
But, after that 2950 print the pair turned-around quickly, falling all the way to the same support zone that had come into play after the December BoC rate decision. This plots from 1.2622-1.2762. That low has since held and that keeps the door open for topside scenarios. The complication at the moment is that short-term resistance is showing around prior support, taken from around the 1.2750 area, and this may act as a hindrance to near-term gains.
As I had shared a little earlier today, the more attractive venue here for bulls appears to be waiting for a higher-low support print above the 1.2617 low. From the below Daily chart, if/when prices can climb back up to the 1.2950 area, a breakout up to the 1.3000 zone looks attractive, at which point bulls will have to contend with Fibonacci resistance a little higher at 1.3033.
USD/CAD Daily Price Chart

Chart prepared by James Stanley; USDCAD on Tradingview
AUD/USD Folds From Resistance
For price action traders candlestick wicks can be very important. A wick at a big level shows a response, but when you have two wicks at that level or perhaps even three, you have more evidence of buyers or sellers defending that line in the sand.
This is what happened last week at the .7275 Fibonacci level in AUD/USD. This is the 50% marker of the November-December sell-off and after four days of resistance around that level to end last week, sellers made a pronounced push after another test to begin this week.
The concern on the short side is that the move may have come in too fast, and there’s now higher-low support potential around the prior spot of resistance as taken from around .7186. But – this is where traders can start plotting for that lower-high provided that price remains below the .7275-.7290 spot on the chart. And given that today’s daily bar looks as if it’ll close as a doji, that door for continued downside remains open until the high is taken-out.
AUD/USD Daily Price Chart

Chart prepared by James Stanley; AUDUSD on Tradingview
--- Written by James Stanley, Senior Strategist for DailyFX.com
Contact and follow James on Twitter: @JStanleyFX


