


Gold Price Talking Points:
- Gold prices put in a week of support at a big spot on the chart, after which buyers drove a strong move on the heels of the FOMC rate decision.
- Gold is now nearing the six-week-high which printed at a key spot on the chart, taken from the 50% marker of the June sell-off. A breach above could lead to an extended move higher.
- The analysis contained in article relies on price action and chart formations. To learn more about price action or chart patterns, check out our DailyFX Education section.

When I last looked at Gold prices a week ago, support had just started to play in from a confluent area on the chart, spanning from Fibonacci levels plotted around 1790-1796. As I had highlighted at the time, there was another piece of support at play considering the bigger-picture bull flag formation.
To learn more about Fibonacci, check out DailyFX Education
After a week-plus of grind at that support, bulls sparked a strong topside move on the heels of yesterday’s FOMC rate decision, and given the backdrop, this is a situation that may have a bit more room to run. The resounding takeaway from yesterday’s FOMC meeting is that the Fed is in no form of hurry. And then taking this morning’s disappointing GDP print, it seems that there’s even less motivation for adjustment anytime soon.
This leaves some fairly open room on the economic calendar: The next big macro risk event is Jackson Hole, after which attention will shift to the September FOMC rate decision. Gold prices have already shown responsiveness after the FOMC rate decision, and this sets up the potential for a bullish breakout in Gold prices.
Gold Four-Hour Price Chart
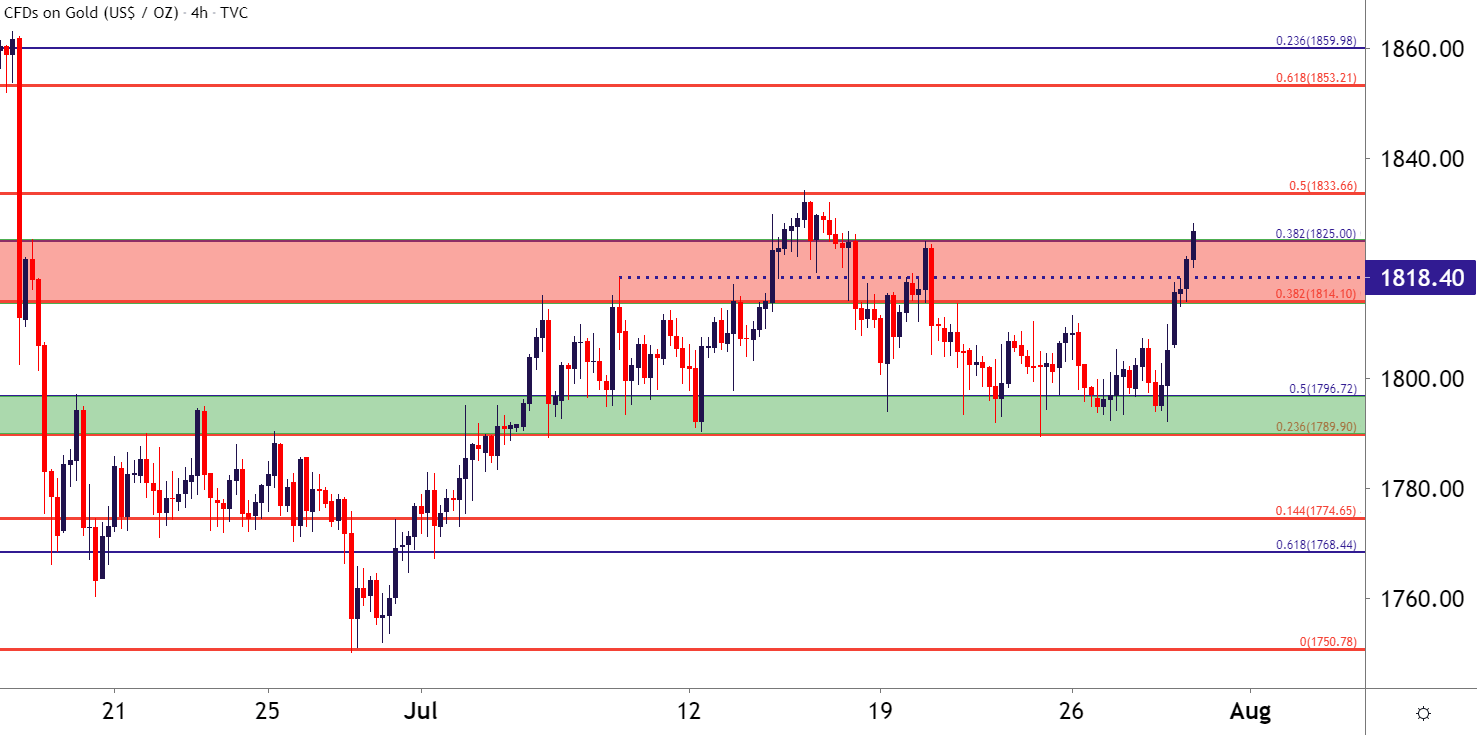
Chart prepared by James Stanley; Gold on Tradingview
Gold Bullish Breakout Potential
At this point, Gold prices are testing resistance inside of the 1833.66 Fibonacci level. That price also constitutes the six-week-high, as well as being the 50% marker of the June sell-off. Overtaking this level could be a key signal as a breach above the 50% retracement indicates a degree of nullification to the June sell-off, which was the worst monthly performance in the yellow metal since November of 2016.
A break above this level could be big for multiple reasons, key of which is the fact that the fresh six-week-high that would come about would also be a degree of nullification of that June sell-off.
Above current prices, the next big zone of resistance runs from 1853-1859, and along the way there’s a prior swing-low at 1843.90 that can function as a more short-term area of nearby resistance.

Gold Daily Price Chart
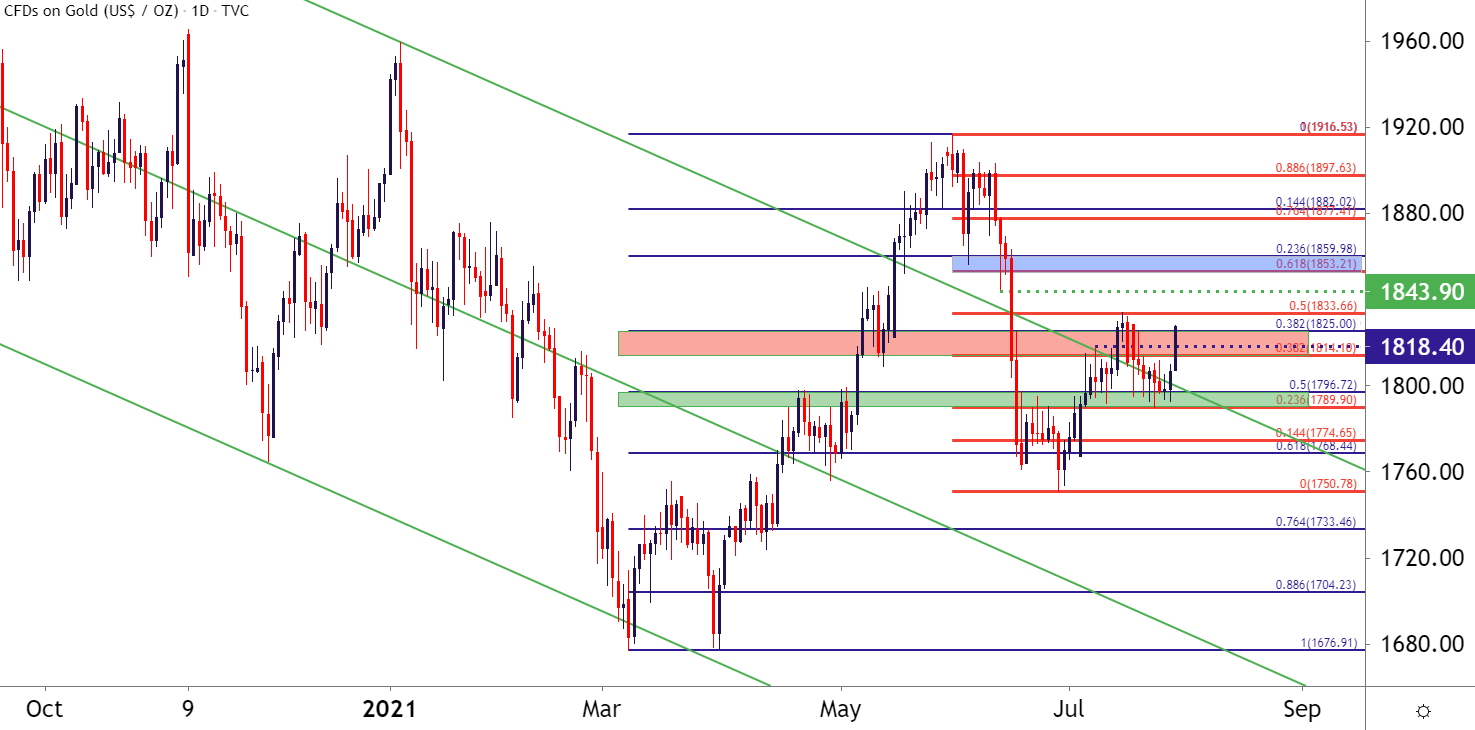
Chart prepared by James Stanley; Gold on Tradingview
--- Written by James Stanley, Senior Strategist for DailyFX.com
Contact and follow James on Twitter: @JStanleyFX


