


Gold Talking Points:
- Gold prices put in an evening star formation to finish last week, with the top of the formation showing at the 50% marker of the June sell-off.
- That resistance reaction lasted through this week’s open, with price action dipping down for a test of support in the 1789-1796 zone.
- The analysis contained in article relies on price action and chart formations. To learn more about price action or chart patterns, check out our DailyFX Education section.

While June was the worst month for Gold prices since November of 2016, the month of July started off in a far different way, with half of that sell-off clawed back in the first half of the month. Prices in Gold caught resistance at the 50% retracement of the June sell-off on Thursday, July 15th. And on the following day, prices fell to close the week, making for an evening star formation on the Daily chart.
Such formations will often be approached with the aim of bearish reversals and given the prevailing backdrop, this can keep the door open for bears. As I had written in the last update on Gold a week ago, “longer-term perspectives may focus more heavily on the potential for bearish trends in Gold, looking for continuation of the move that showed up in June,”
To learn more about evening star formations, check out DailyFX Education
Gold Daily Price Chart: Evening Star

Chart prepared by James Stanley; Gold on Tradingview
Gold: Bullish Perspective
For Gold bulls, a hold of the current support zone is key. The month of June was harsh but the pickup in July saw prices push back above the bull flag formation. That bull flag took about eight months to build and came fresh on the heels of last summer’s run, when Gold prices set a fresh all-time-high.
But from August through March, bears very much remained in charge, with buyers taking control in April and finally breaking above the formation in mid-May.
But life outside of the channel was brief, as prices fell back a month later after the FOMC tweaked the dot plot matrix, leading to that worst month in Gold since November of 2016.
But from the below Daily chart, you can see where the current support zone lines up with the top side of that bearish channel making up the bull flag, so there is a case to be made on the long side, as well.
Gold Daily Price Chart
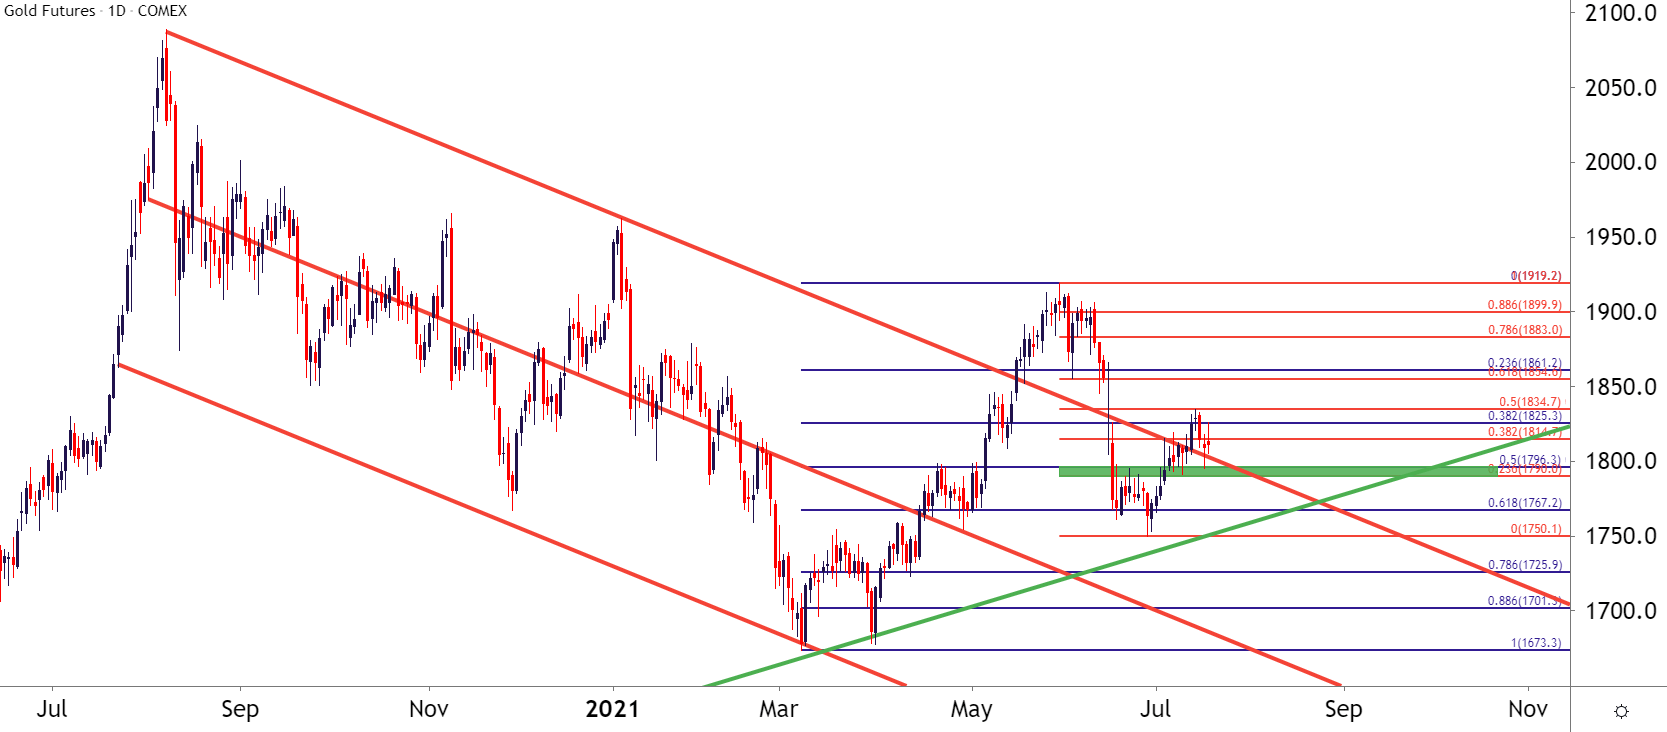
Chart prepared by James Stanley; Gold on Tradingview
--- Written by James Stanley, Senior Strategist for DailyFX.com
Contact and follow James on Twitter: @JStanleyFX


