


US Dollar, USD/CAD, NZD/USD Talking Points:
- It’s a big week with a number of high-impact releases to go along with numerous earnings reports from American corporates.
- The US Dollar has both a short-term head and shoulders pattern and a longer-term inverse head and shoulders pattern: Will bulls or bears win the tug-of-war?
- The analysis contained in article relies on price action and chart formations. To learn more about price action or chart patterns, check out our DailyFX Education section.
It’s a huge week for the headlines as a number of earnings reports and US data releases will drive price action this week. And after last week’s huge beat by Netflix, hope is high around the tech sector for a similar outing, with the likes of Microsoft, Tesla and Apple all reporting this week. Outside of that, each day Tuesday through Friday brings a high-impact US item on the economic calendar, with the highlight being the Wednesday FOMC rate decision and press conference.
DailyFX Economic Calendar: High-Impact Items for Week of Jan 25, 2021

Taken from the DailyFX Economic Calendar
US Dollar Price Action Builds into Head and Shoulders Pattern
At this stage the US Dollar is holding onto 2021 gains after the currency started the year in an oversold state. Also of note was a falling wedge pattern that had formed, and these formations will often be approached with the aim of bullish reversals. And while we’ve seen a little bit of that reversal theme, buyers haven’t exactly been able to keep control of the matter as the USD turned-around from a failed test at the 91.00 handle last week.
At this stage – there are formations on either side of the Greenback that can be used for the week ahead. On a short-term basis, there’s a head and shoulders pattern with a neckline around the psychological level of 90.00 on DXY.
To learn more about the head and shoulders pattern, check out DailyFX Education
US Dollar Four-Hour Price Chart
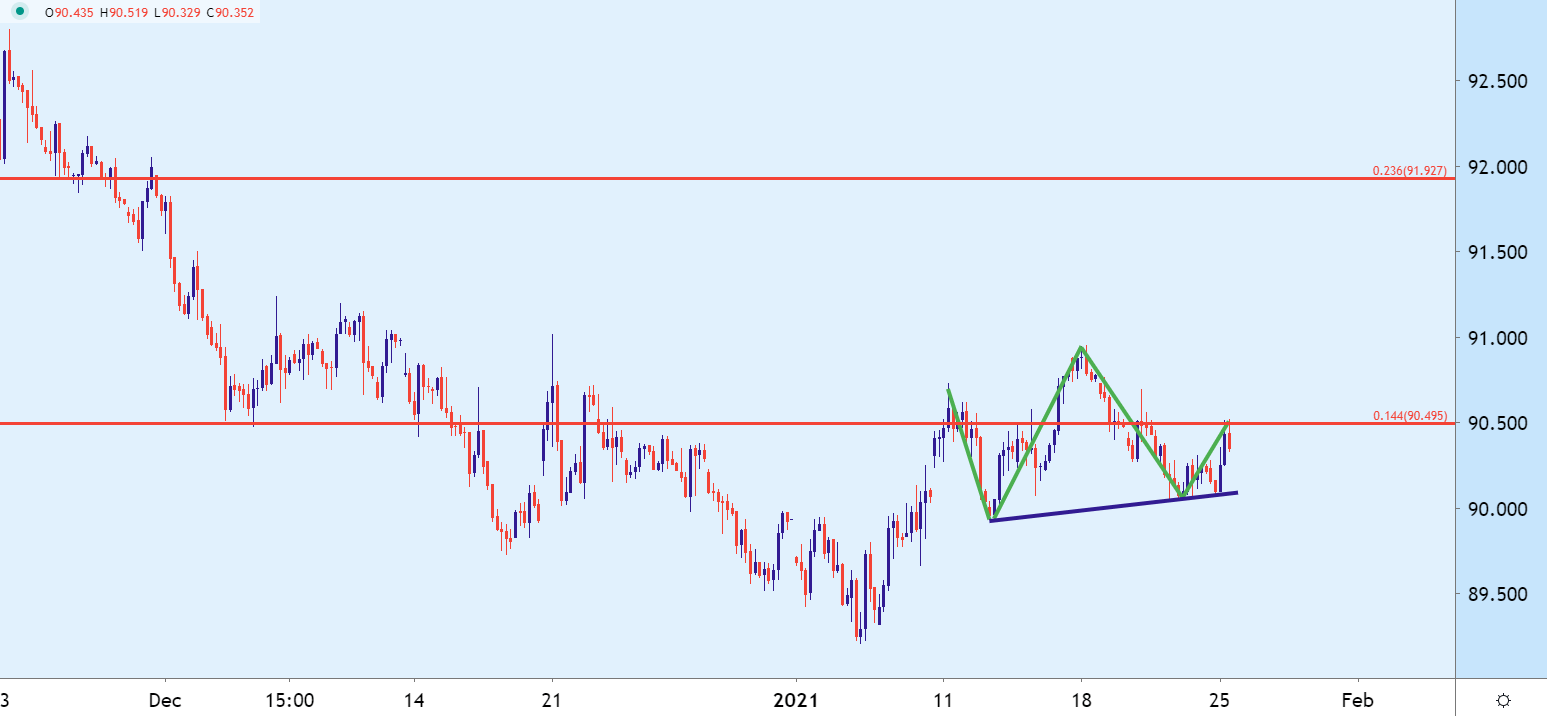
Chart prepared by James Stanley; USD, DXY on Tradingview
Taking a step back and, as noted earlier, there’s a fairly clear example of the mirror image of the above formation. The inverse head and shoulders pattern will often be approached with the aim of bullish breakouts, looking for buyers to push the bid beyond the previously established neck-line, which is shown on the below chart in maroon.
Adding to the intrigue is another formation that had built into the 2020 close, and that’s a falling wedge formation that’ll often be approached with the aim of bullish reversals. The falling wedge and inverse head and shoulders pattern both point to the possibility of higher prices; and the argument can be made that the falling wedge has so far filled-in, as buyers have continued to support the Greenback since the currency started to venture above that formation.
The big question is whether USD bulls get that motivation to breakout to a fresh high, but this would put the focus on the area around the 91.00 handle on DXY.
US Dollar Eight-Hour Price Chart
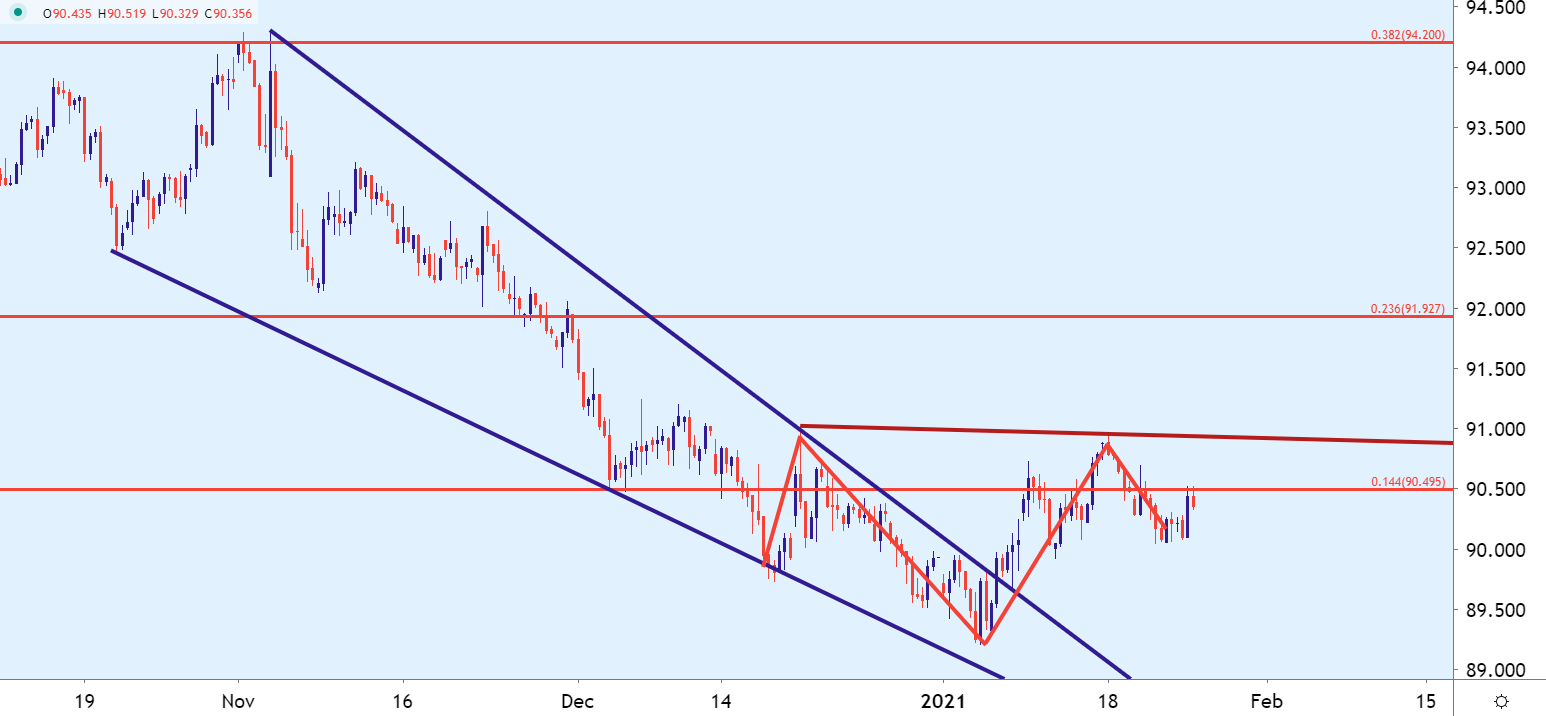
Chart prepared by James Stanley; USD, DXY on Tradingview
For USD-Strength Themes, USD/CAD Remains Interesting
For those looking for USD-strength, there may be some amenable items to work with in USD/CAD.
USD/CAD tested a major long-term level last week at 1.2622, as this is the 50% marker of the long-term 2002-2007 major move in the pair. This level was looked at in last week’s Tuesday webinar, and it soon came into play a couple of days later. But – perhaps more intriguing than that, when that support test finally did come into the equation, the pair put in a morning star pattern, as the Thursday support test led to a really strong day on Friday. Morning star patterns are often followed with the aim of bullish reversal, and given the pair’s proximity to current resistance, this would keep the door open for bullish breakout potential.
To learn more about morning star patterns, join us in DailyFX Education
On the below USD/CAD Daily chart, that morning star formation has been outlined in Green; and also of interest is a possible falling wedge that’s also brewing which, again, points to the potential for topside themes in the pair.
To learn more about falling wedge patterns, join us in DailyFX Education
USD/CAD Daily Price Chart

Chart prepared by James Stanley; USDCAD on Tradingview
For USD-Weakness Themes, NZD/USD Remains of Interest
On the short-side of the US Dollar, NZD/USD could be of interest. The pair came back to life last week on the back of stronger-than-expected inflation data out of New Zealand. This helped the pair to recover from a prior sell-off, while reclaiming support from an area of prior trend-line resistance.
This has built into a really interesting formation known as a cup and handle formation, which will often be approached with the aim of bullish continuation.
To learn more about the cup and handle formation, join us in DailyFX Education
NZD/USD Four-Hour Price Chart

Chart prepared by James Stanley; NZDUSD on Tradingview
--- Written by James Stanley, Strategist for DailyFX.com
Contact and follow James on Twitter: @JStanleyFX


