


US Dollar Price Action Talking Points:
- The US Dollar is working on a non-completed evening star formation, which will often be approached with the aim of bearish reversals.
- EUR/USD is working on the mirror image of that formation with a morning star – but that’s propelled price action into a big zone of resistance at prior support.
- The analysis contained in article relies on price action and chart formations. To learn more about price action or chart patterns, check out our DailyFX Education section.
The US Dollar has been strong so far in 2021 trade, coming in stark contrast to last year, particularly the final eight months when USD-weakness showed very visibly. But, as we came into the New Year, the oversold US Dollar began to show a couple of bullish factors and as looked at in the webinar a couple of weeks ago, the door was wide open to pullback themes in the currency. So far, that’s played out, with USD moving up to the ‘r2’ zone that was looked at in that webinar.
However, as shown today, there may be some bearish scope as that resistance inflection has led to the build of an interesting candlestick formation. The evening star pattern will often be approached with the aim of bearish reversals. This pattern isn’t yet confirmed as we’ll have to wait for the close of the daily bar at 5pm ET to confirm that as the case. But – if this formation does hold, the door may soon re-open to bearish USD-strategies, looking for the same type of scenario that populated in the Greenback for much of last year.
To learn more about evening star formations, join us in DailyFX Education
US Dollar Daily Price Chart: Potential Evening Star Testing Support
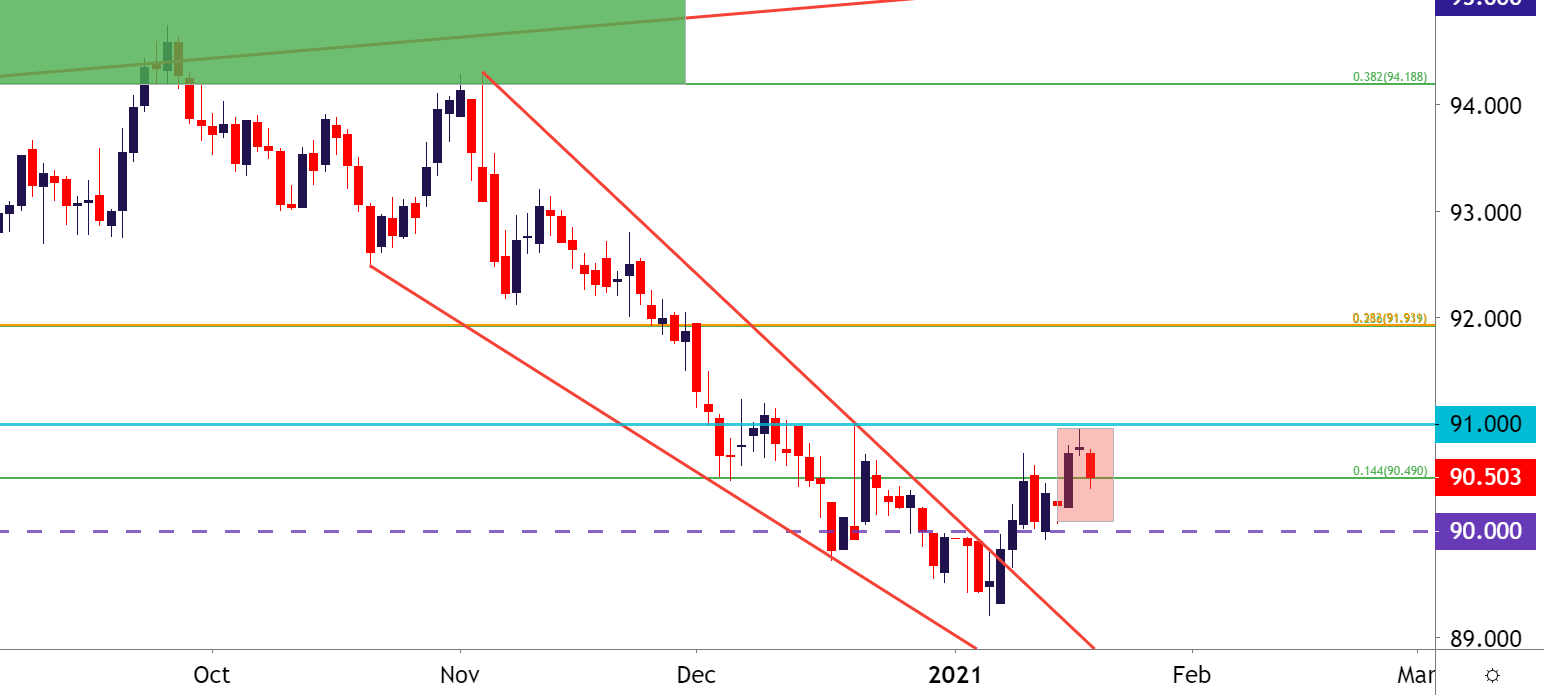
Chart prepared by James Stanley; USD, DXY on Tradingview
EUR/USD Bounces Up to a Big Zone of Resistance
The near mirror image of the above setup can be seen in EUR/USD. The pair is currently working on a morning star pattern which will often be approached with the aim of bullish reversals. The difference here is of note, as today’s strength in the pair has merely pushed prices up to a key zone of resistance as taken from prior support.

This zone runs from 1.2134-1.2167 and has been in-play since early-December. It first came in as resistance, helping to hold the highs, but buyers were eventually able to drive above this zone by the middle of the month. But – at that point, prices found support off of this zone on the way up to fresh two-year-highs. As USD-strength has showed up so far this year, EUR/USD has pushed back below this area, and today’s strength has seen price action flicker back into this zone.
So – for the bullish look, traders will likely be focusing-in on that potential morning star build. On the bearish side – resistance at prior support can keep the door open for bearish continuation scenarios.
To learn more about morning star formations, join us in DailyFX Education
EUR/USD Daily Price Chart
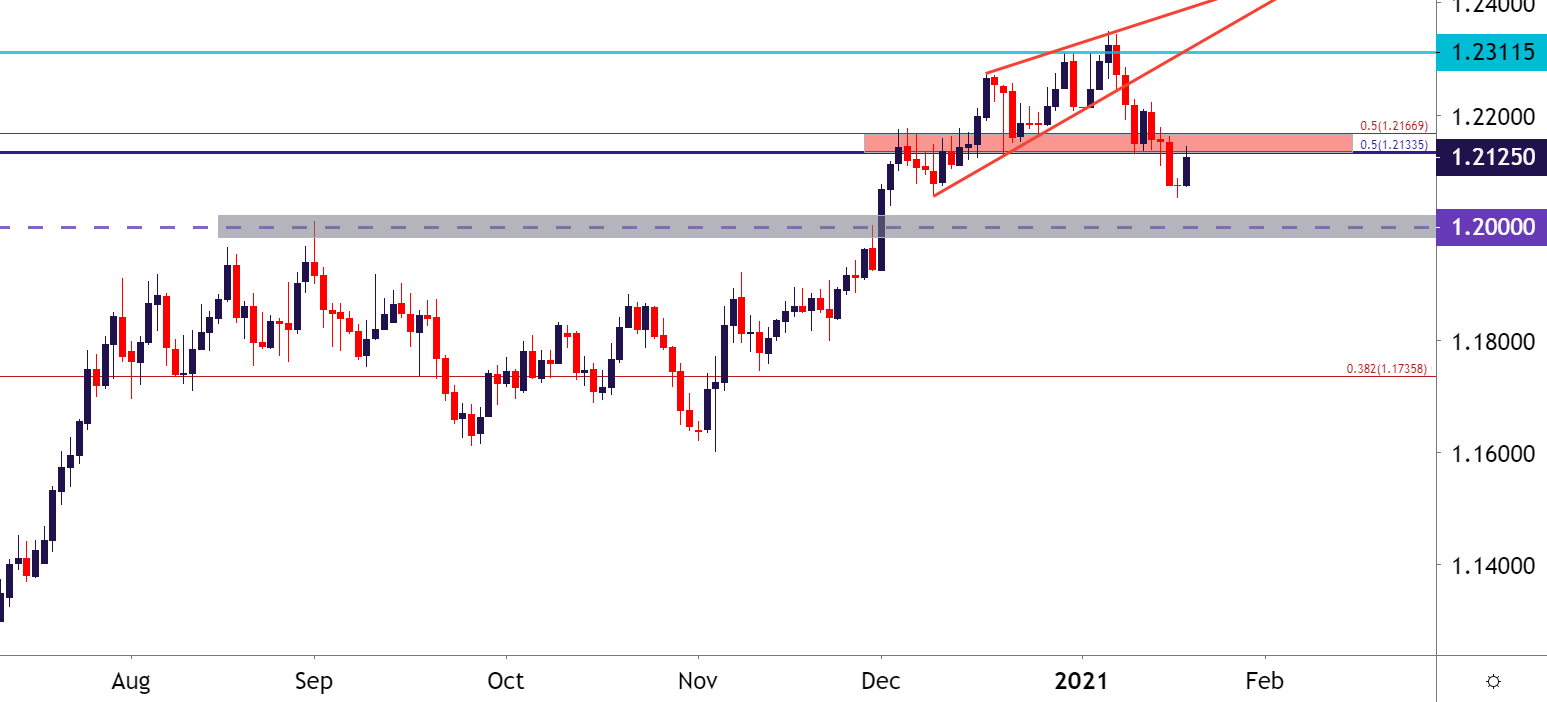
Chart prepared by James Stanley; EUR/USD on Tradingview
GBP/USD Support Holds Above 1.3500 For Now
Cable saw a similar doji over yesterday’s price action and the spot that this showed up was very interesting, just a few pips above the 2019 high of 1.3515. Unlike EUR/USD, however, today’s strength hasn’t built for a potential morning star formation, and this can make GBP/USD perhaps a bit more attractive for scenarios of USD-strength.
One item of interest in the pair appears to be resistance around the 1.3700 handle, which has so far held multiple topside tests.
GBP/USD Daily Price Chart
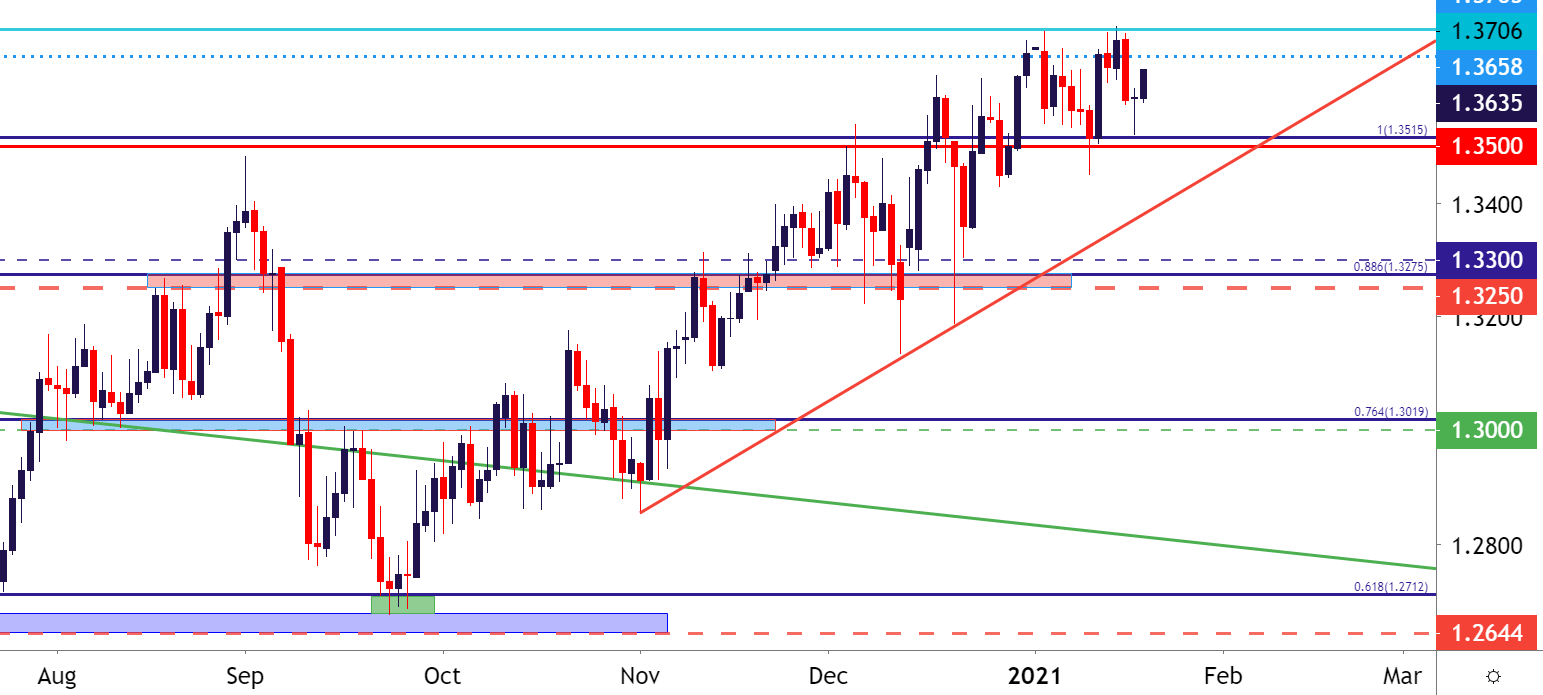
Chart prepared by James Stanley; GBP/USD on Tradingview
AUD/USD Setting the Stage for Possible Break?
AUD/USD had a really strong outing in the final months of 2020 trade, heavily reversing a prior bearish trend as the pair worked up to fresh two-year-highs.

At this point, some longer-term resistance has shown from around the .7750 psychological level. This zone saw numerous tests for about a year from April of 2016 into April of 2017, eventually with buyers taking over to induce a topside breakout. This level came back into the equation in the first week of 2021 but, so far, buyers haven’t been able to leave it behind, keeping the door open for pullback and/or reversal scenarios.
AUD/USD Four-Hour Price Chart
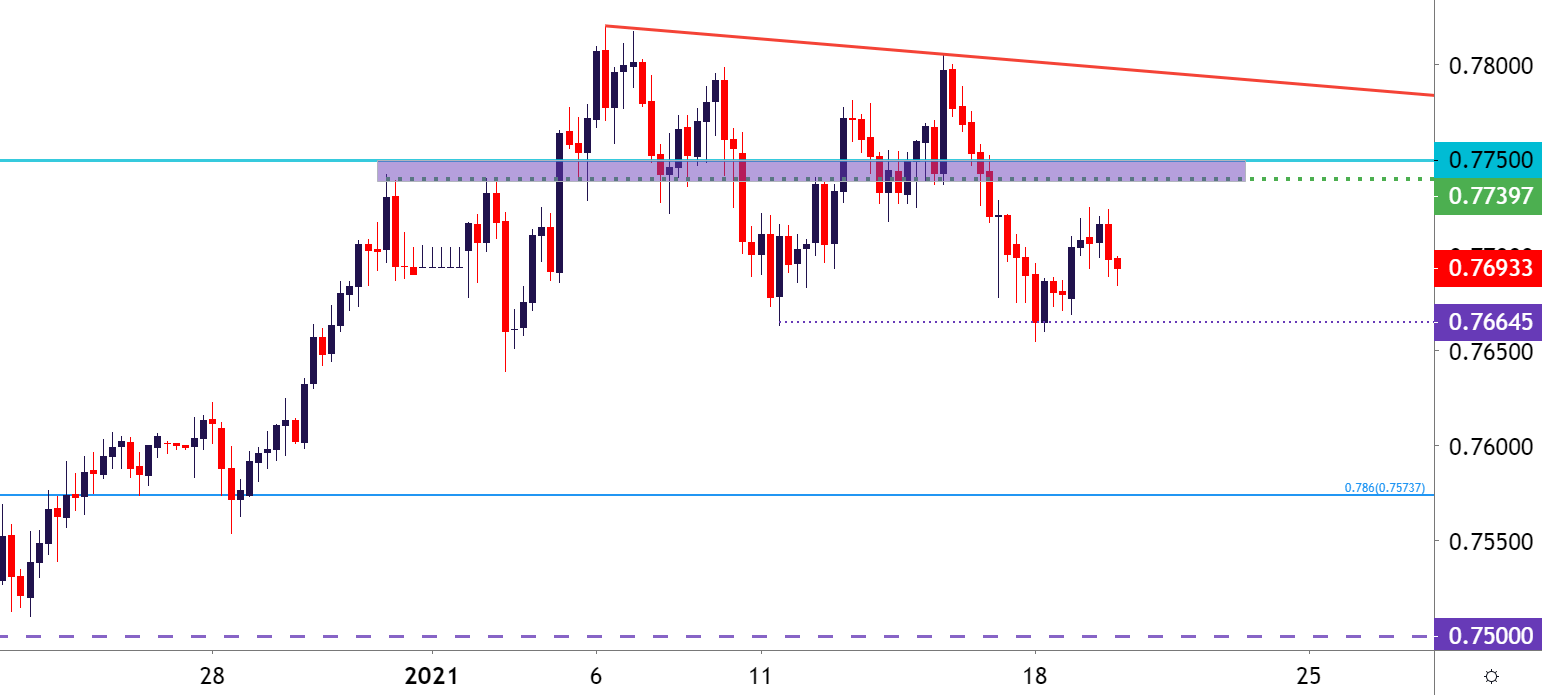
Chart prepared by James Stanley; AUD/USD on Tradingview
NZD/USD Bulls Start to Slip
NZD/USD had a strong run in 2020 but, already in the New Year that strength has started to slip. The pair holds breakdown potential around .7100 support currently, and this can keep the door open to another test of the .7000 psychological level. That price had given a dose of support in late-December, and if bears can continue to push, it may soon come back into the equation.
To learn more about psychological values, join us in DailyFX Education
NZD/USD Four-Hour Price Chart
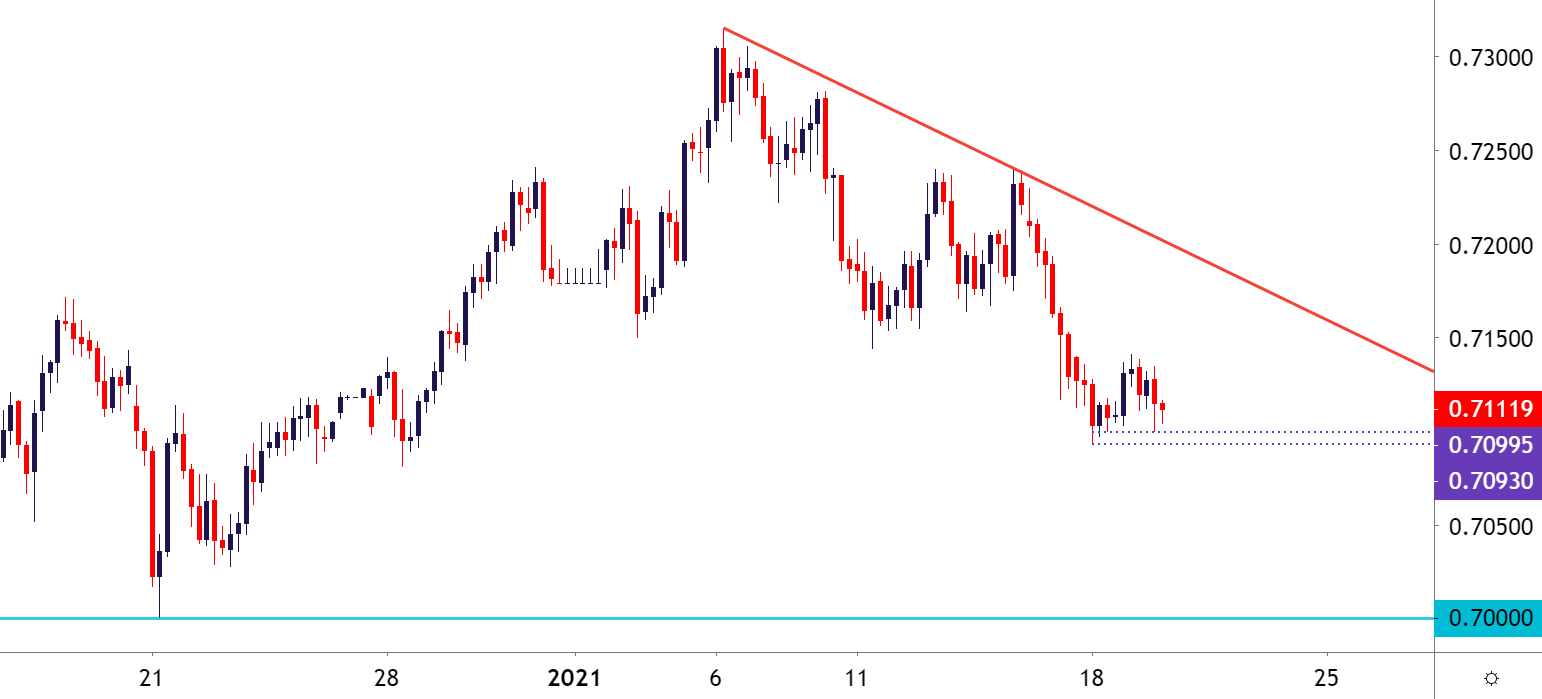
Chart prepared by James Stanley; NZD/USD on Tradingview
--- Written by James Stanley, Strategist for DailyFX.com
Contact and follow James on Twitter: @JStanleyFX


