


What is the Commitment of Traders report?
- We previously looked at using the COT report in FX trading, in this article, we take more of a big-picture perspective on this very important sentiment report.
- The COT report can offer a unique perspective for sentiment, helping to compliment IG Client Sentiment in the effort of getting a better grasp on positioning in a market at a specific point in time.
The Commitment of Traders (COT) report is published weekly by the Commodity Futures Trading Commission (CFTC). It’s often times referred to as the “COT” report. It provides a breakdown of open interest for all exchanged-traded futures contracts under the rule of the CFTC. It is published each Friday afternoon Eastern Standard Time (EST), and represents the positioning profile of all market participants for the week ending on Tuesday. According to the CFTC, the COT has informal beginnings which can be traced back as far as 1924; however, the report officially began release in 1962. It has gained increasing popularity in the past 25-30 years with the increasing importance and size of the futures market.
There are three general types of market participants which are represented in the report – commercial traders, non-commercial, and non-reportable traders. Each group has its own specific interest for their involvement in the futures market.
Commercial traders, also known as ‘hedgers’, are traders with exposure to a commodity or financial instrument. For example, corporations who require raw materials for the production of goods. To these companies it is viewed as a form of insurance against adverse price fluctuations and allows for a means of price stabilization of key inputs which impact the cost of production. It can also apply to financial instruments, such as interest rate contracts; where for example, a bank might want to hedge against fluctuations in interest rates.
Non-commercial traders, also known as ‘large speculators’, are entities such as hedge funds, Commodity Trading Advisors (CTAs), Commodity Pool Operators (CPOs), and other large traders who use the futures market to speculate on price fluctuations.
Non-reportable traders, also known as ‘small speculators’, are the smallest traders in the marketplace. These can be individuals, proprietary trading firms, small hedge funds, and anyone who establishes small position sizes for speculative purposes. This group has grown over the years with the advent of technology and access to the market electronically.

What information can be gained through the COT report?
(For purposes of simplicity, we’ll refer to commercial traders as ‘hedgers’, non-commercials as ‘large speculators’, and non-reportable as ‘small speculators’.)
First off, it’s worth noting that due to the infrequent and delayed release (weekly reporting on Friday’s for the week ending on Tuesday), COT data is best used as an intermediate to long-term indicator. It’s a sentiment analysis tool and should be used in conjunction with other forms of analysis, i.e. – technical & fundamental.
There is more than one way to gain information from these weekly reports, but first let’s determine which of the three aforementioned group of traders might offer the most valuable information.
Hedgers and large speculators take positions opposite of one another. The reason for this is due to the differing intentions just discussed. Hedgers are interested in price stabilization while large speculators are looking to profit from large price fluctuations hedgers try and avoid. As the market rises hedgers tend to be sellers while large speculators, collectively, typically employ trend-following strategies which would look to go long the market. The same can be said in reverse for markets which trend lower.
In the graph below, in the gold market you can see a nearly 100% inverse correlation between the activity by hedgers and large speculators. The tendency for large specs to use trend-following strategies can also be observed, as the general direction of their trading activity and the price of gold move relatively in-line.
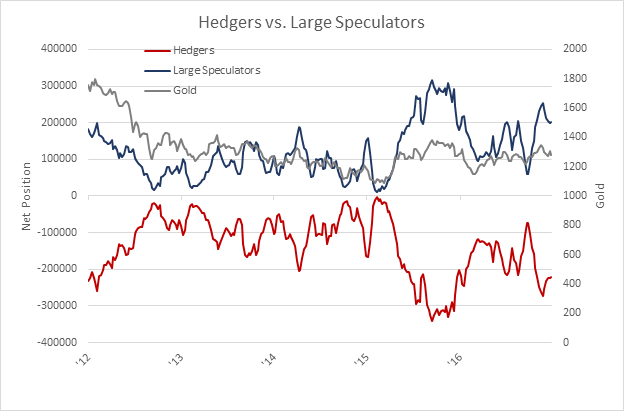
Data Source: CFTC
How might this information be useful? We can safely take the commercial traders out of the equation since we already have a good idea of what they are doing by just looking at what large speculators are doing. We won’t focus on small speculators, as they tend to exhibit more erratic behavior, but loosely follow the positioning of the large speculators. It’s just not with the same degree of negative correlation observed between large speculators and hedgers.

Various ways COT data can be interpreted and incorporated into your trading methodology
It’s important to first remember that COT studies provide a gauge of market sentiment, and as such, they need to be used in context with other factors which fit within your trading methodology (i.e. price action and fundamental analysis). They are best used to identify broader conditions which may be more or less conducive for price to move in a particular direction. Let’s look at how this can be most effectively achieved by looking at indications from the COT report as a trend identifier, an overbought/oversold indicator, as well as a sign of a breakout leading to a new trend.
Large speculators typically look to identify intermediate to long-term trends
Let’s look at how we might be able to utilize the information observed in the activity of large speculators. When strong trends develop, this group tends to be buying when the market is rising and selling when the market is falling. By looking at which direction their positioning is heading, this information can be used as not only a gauge of direction but trend strength as well.
Large specs following the trend
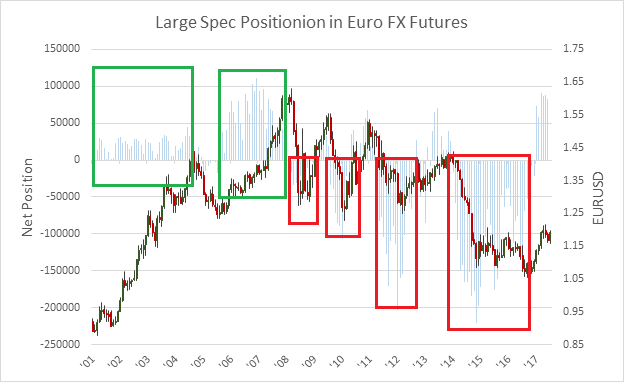
Data source: Bloomberg, CFTC
Breakout/Momentum: Sharp changes in positioning with price can indicate a breakout and momentum as the trend changes
The Japanese Yen was in a very persistent downtrend from 2011-2015, and large speculators were correctly net-short for much of the bear market. However, in early 2016 they not only flipped from short to long, it occurred very rapidly. The sudden change, in only four weeks, saw their position-size move from the lower one-third of the range over the prior year to net-long for the first time in several years.
Around this same time the Yen experienced a price breakout above resistance to its highest levels in 15 months. The sudden surge in buying turned out to be a sign of momentum as the breakout was sustained and led to a multi-month rally of approximately 15%. Notice at other times we didn’t have this signaling with several failed short-covering rallies within the context of a strong downtrend. The key distinguishing factor here from the prior times was that large specs were net-short and there also wasn't any confluence with price changing trend (i.e. breakout above resistance).
Japanese Yen futures reverse course on surge in large spec buying, break above resistance
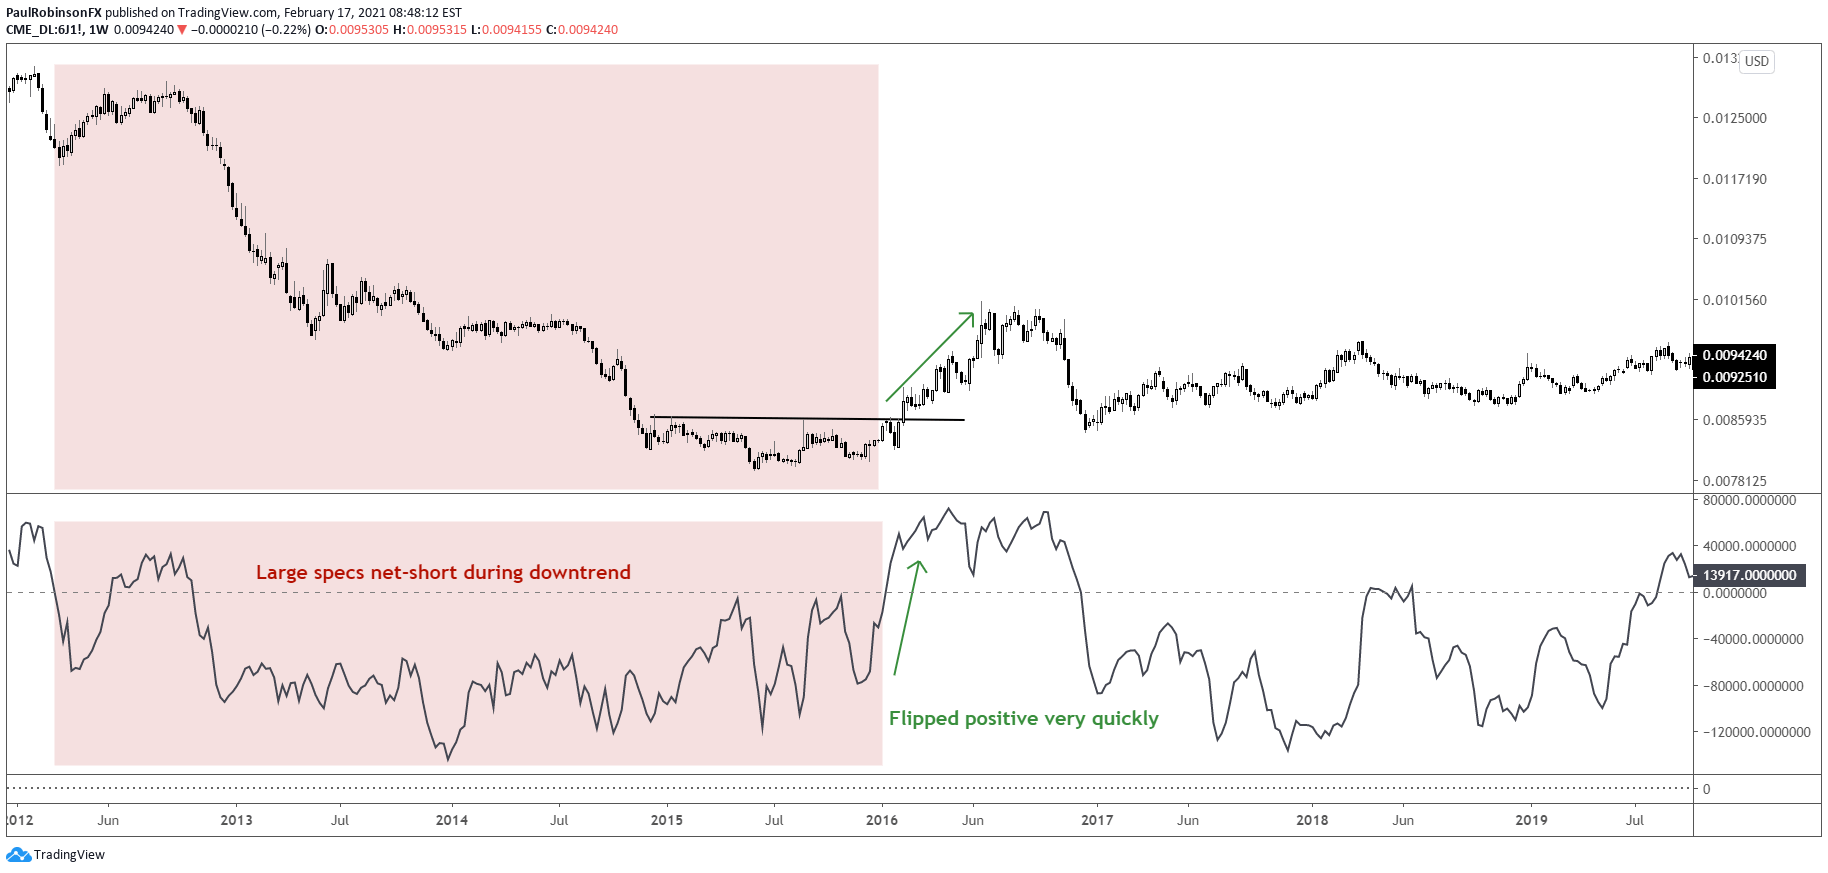
Created with Tradingview.com
Overbought/Oversold indicator
Many traders use momentum indicators such as RSI and Stochastics to identify when a market may be overbought or oversold. As an intermediate to long-term indicator the COT profile of large speculators can be used similarly. How this behavior is viewed needs to be taken into context with market conditions, trend, and how other factors are impacting the market.
Copper went into a bear market from 2011-2016. During this time there were numerous attempts by the commodity to rally, but within the context of a clear downtrend those only proved to be temporary before sellers took over again. Net-positioning on many of those occasions was pushed to a 52-week extreme which coincided with the peak of the counter-trend rallies. It acted as an indication of overbought in a pervasive downtrend.
Copper futures trending lower with peaks in buying leading to swing-highs
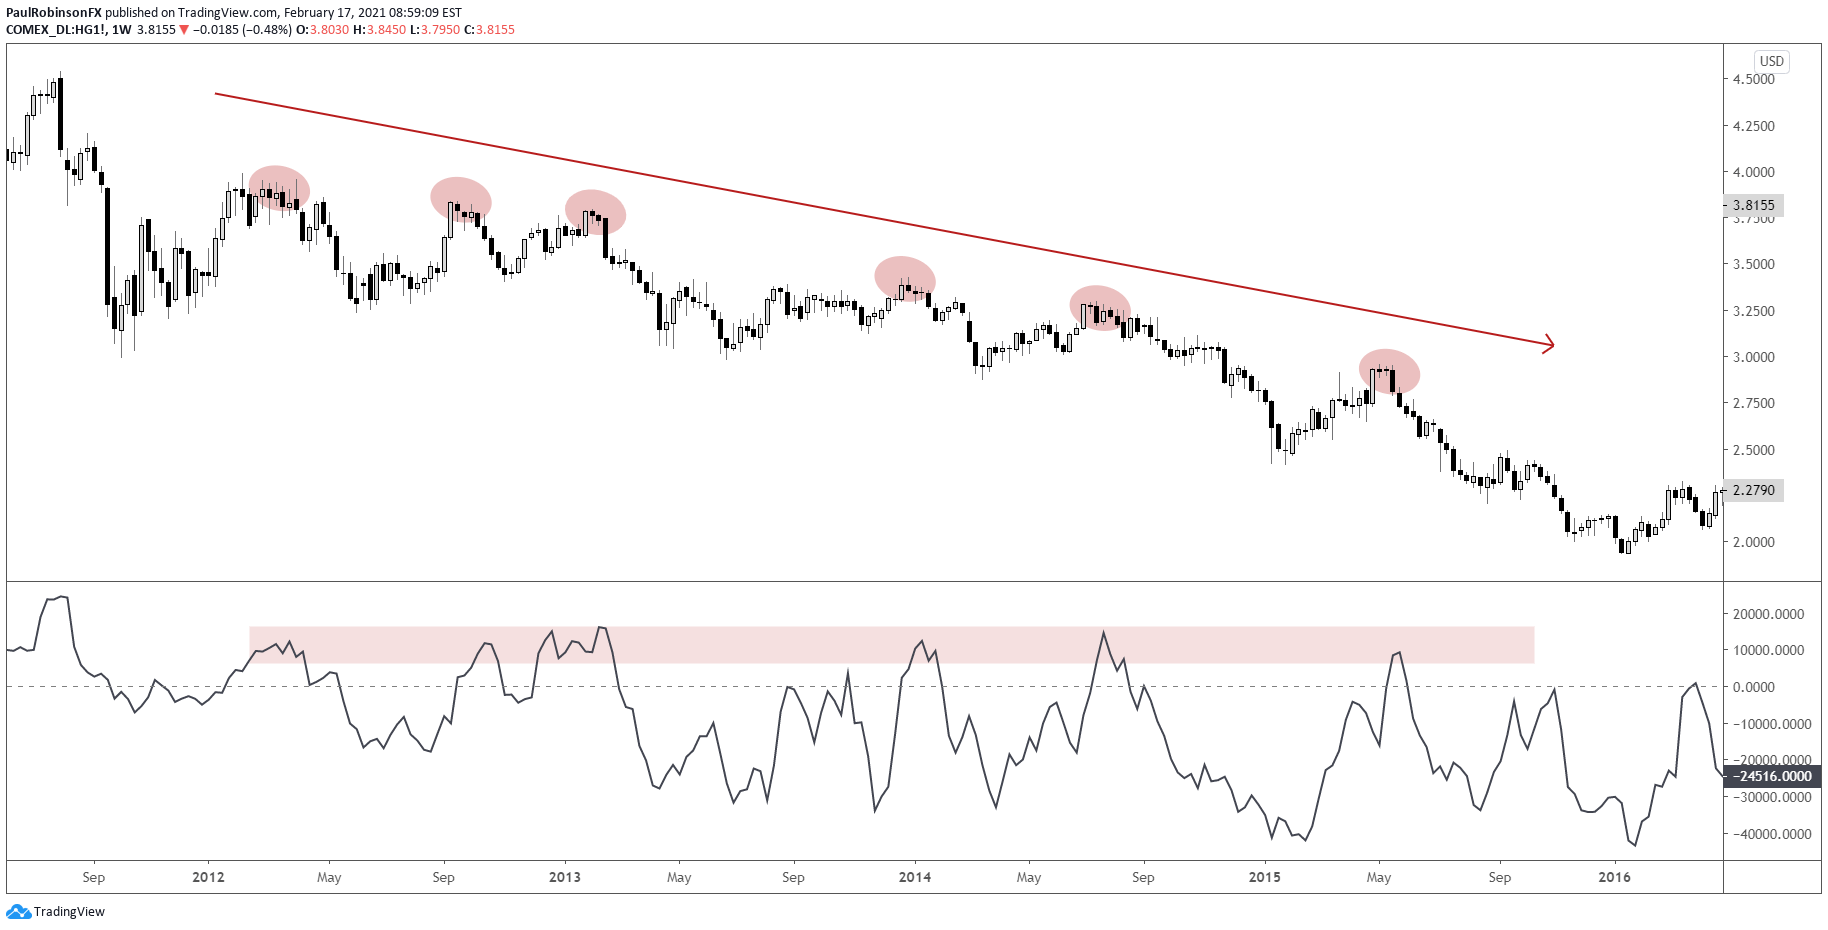
Created with Tradingview.com
COT versus IG Client Sentiment data
As noted earlier, due to the infrequency and delay in reporting, the COT report is best used as an intermediate to long-term sentiment indicator. This is where more timely data can be used to determine short-term sentiment, and even in conjunction with the COT data. IG Client Sentiment data, or IGCS for short, shows real-time positioning of retail traders through a ratio of long positions versus short positions. IGCS can be an effective contrarian indicator as the retail crowd tends to trade against developing trends.