


Japanese Yen, USDJPY and EURJPY Technical Forecast Talking Points:
- Following USDJPY’s November 10 breakdown after the softer US CPI release, momentum has all but stalled out for the benchmark cross
- This past week’s range echoes the congestion across the broader market with short-term – and likely short-lived – breaks a tangible risk
- Other Yen crosses like EURJPY have offered up significantly more constrained runs for the Japanese currency as liquidity leverages the influence of the US Dollar

Technical Forecast for the Japanese Yen: Bearish
A week ago, it seemed that the Japanese Yen was moving into a position to begin an incredible recovery from multi-decade lows. With the benchmark USDJPY posting its largest single-day loss (545 pips) in 24 years back on November 10th, the scale looked like more than just a distinctive change in bearing. The technical structure shifted from weeks of consolidation with a descending wedge with a floor in the 50-day simple moving average (SMA) and the former range resistance as support around 145. The break of that floor put us in for the first genuine lower swing low since the end of 2020. With such a remarkable head of steam, it seemed as if it would be easy to carry the bearish trend. However, that has not been the case this past week. The momentum died out almost immediately. The shift towards consolidation now shows a series of higher lows with level resistance in the 100-day SMA at 141. Liquidity will likely be suppressed across the financial system in the week ahead, but that doesn’t preclude volatility. In fact, short-term breaks on such narrow ranges are a greater risk in this environment.
| Change in | Longs | Shorts | OI |
| Daily | -2% | 2% | 0% |
| Weekly | 12% | -16% | -6% |
USDJPY with 50 and 100-Day SMAs Along with Known Dates of Japanese Intervention (Daily)
1w
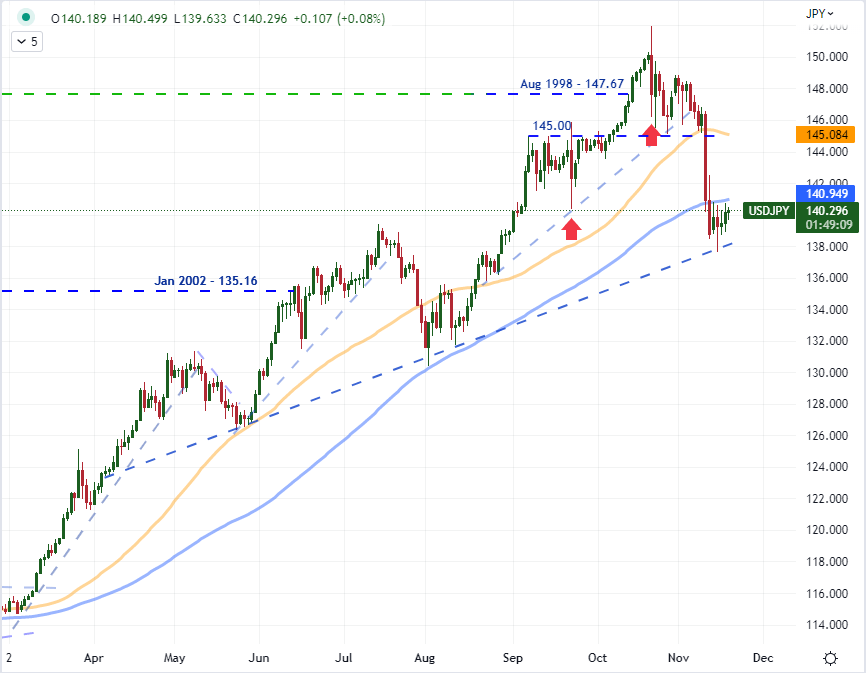
Chart Created on Tradingview Platform
Whether or not the Yen makes a break in the coming week likely depends on event-based surprises and the strong-arming of the US Dollar. Typically, individual currency’s divine their own destinies, but it is difficult to escape the influence of the Greenback given the sheer scale of its liquidity. As the third most liquid currency in the world, you would think that the Yen can dictate plenty of activity of its own; but among the crosses, there is significantly less consistency in clarity of trend. Even EURJPY, the second most liquid of the Yen crosses presented a less pressurized reversal pattern through the November 10th volatility. While it did slide, it was a far more restrained move. Looking further out the depth charts – GBPJPY, CADJPY, AUDJPY – the effort was even more tepid. Unless a strong motivated to charge the Yen comes along, the bias for breaks will likely conform to the larger trend.
Chart of EURJPY with 100-Day SMA, USDJPY Overlay, 20 and 60-Day Correlations (Daily)
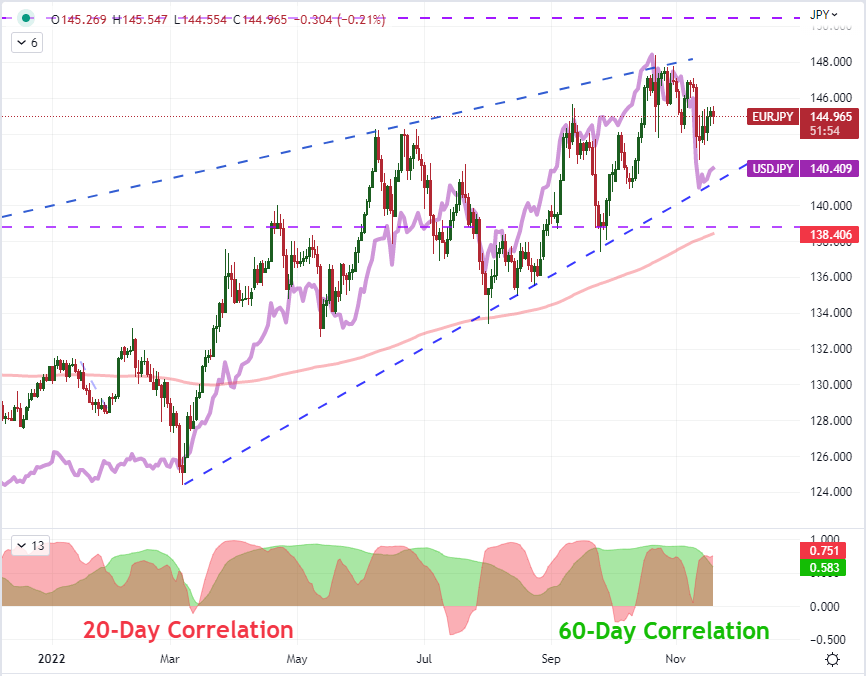
Chart Created on Tradingview Platform
Taking a look at the bigger picture, USDJPY’s monthly chart still gives a remarkable picture of how far this pair has scaled over the past 16 months. Even though we are looking at the biggest month’s retreat as of the 18th (-5.6 percent) since June 2016, we have barely scratched the surface in terms of a reversal. On this scale, the broader trend doesn’t seem as if it has been turned; then again, the measures of technical support look a lot less influential at this altitude as well. While the limited liquidity of the week ahead may throttle traction that would be needed to feed a more systemic reversal, there is still a significant tension in this market as it looks for its ultimate bearing. I don’t expect this market to settle within its current November range through the remainder of the year.
Chart of USDJPY with 20-Month SMA (Monthly)

Chart Created on Tradingview Platform


