


USD/MXN, JPY/MXN - Prices, Charts, and Analysis
- USD/MXN bounces after posting a multi-year low.
- Will demand for EM currency yield continue to boost the Mexican Peso?

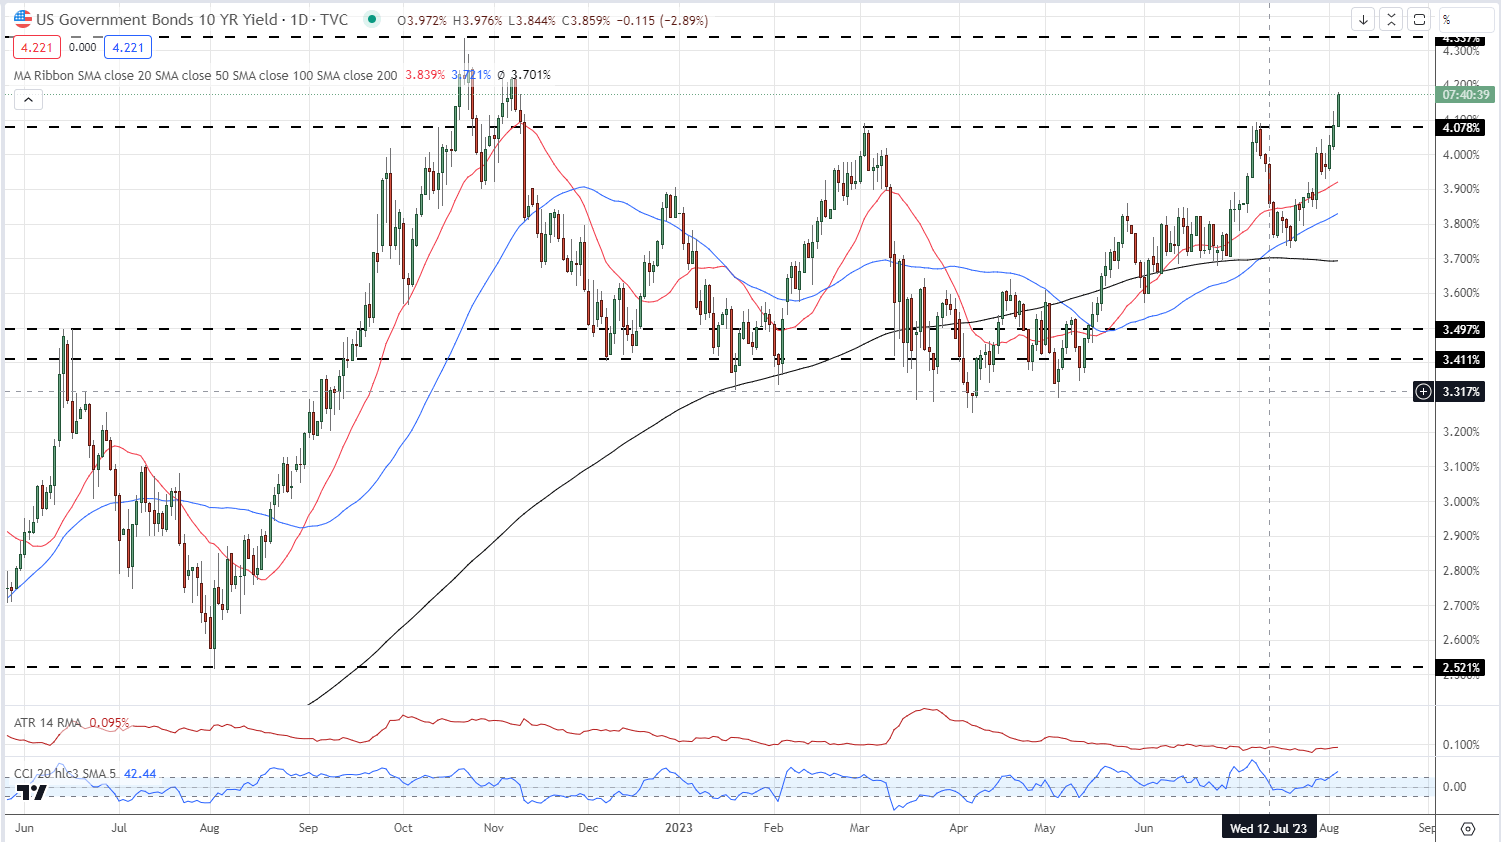
One of the star FX performers over the last three years, the Mexican Peso is currently giving back a small part of its recent gains to a resurgent US dollar. The USD/MXN rate hit its lowest level in over seven years last Friday (16.63) before this week’s pick up in US Treasury yields gave the greenback a boost across the board. US Treasury yields are moving higher as fears of a recession fade, while the heavy upcoming supply schedule is giving US Treasury investors the backdrop to demand more yield for their money.
US 10-Year Treasury Yield Daily Chart – August 3, 2023

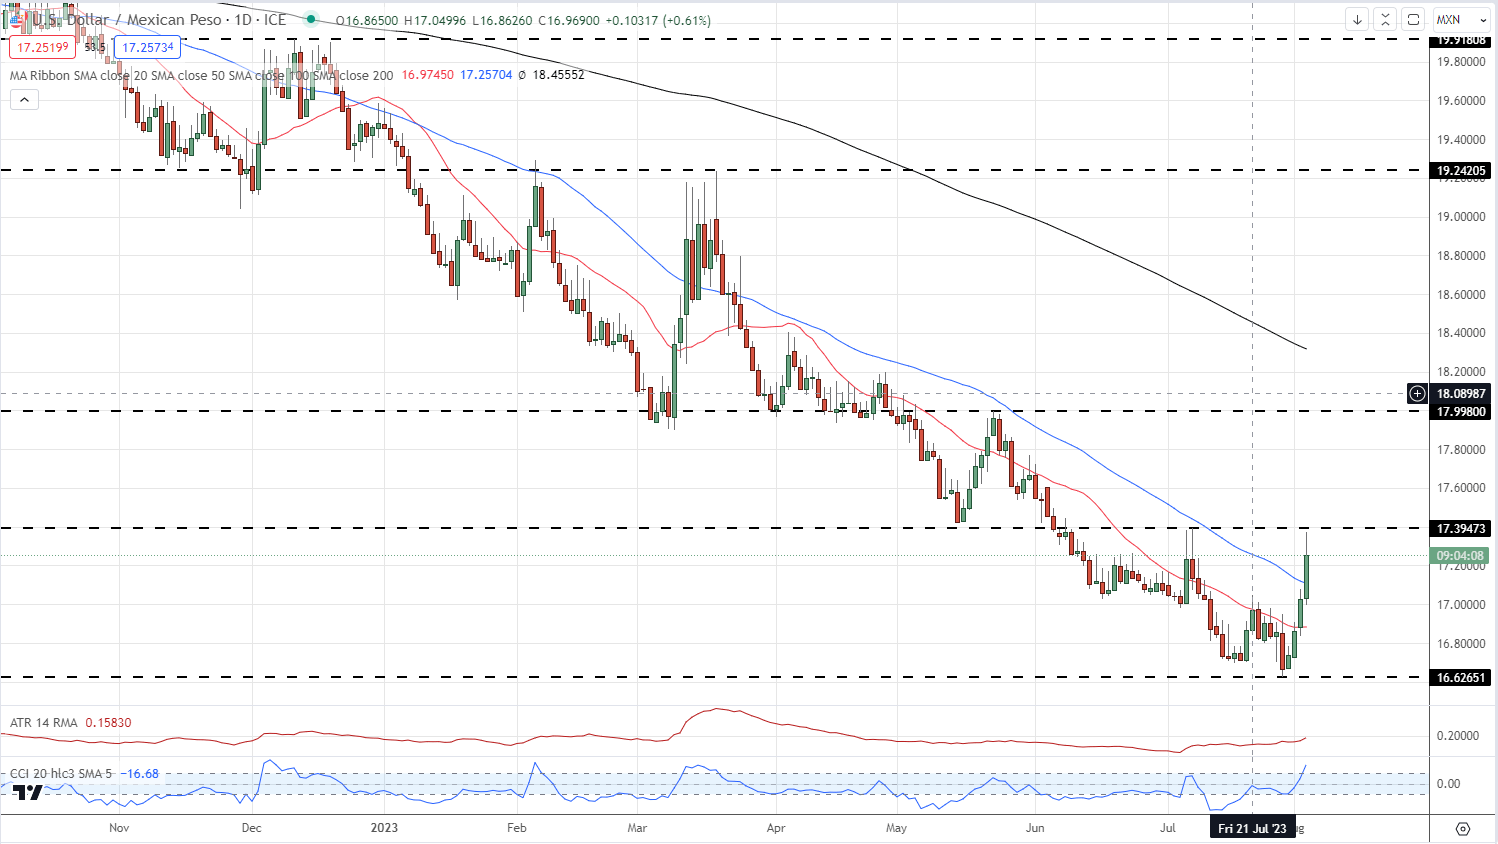
The daily USD/MXN chart shows the pair has now broken above both the 20- and 50-day simple moving averages for the first time since mid-March. These two moving averages have been guiding the pair lower for around one year and a confirmed break above both may signal a slowdown, or an end, to the longer-dated move lower.
USD/MXN Daily Price Chart – August 3, 2023
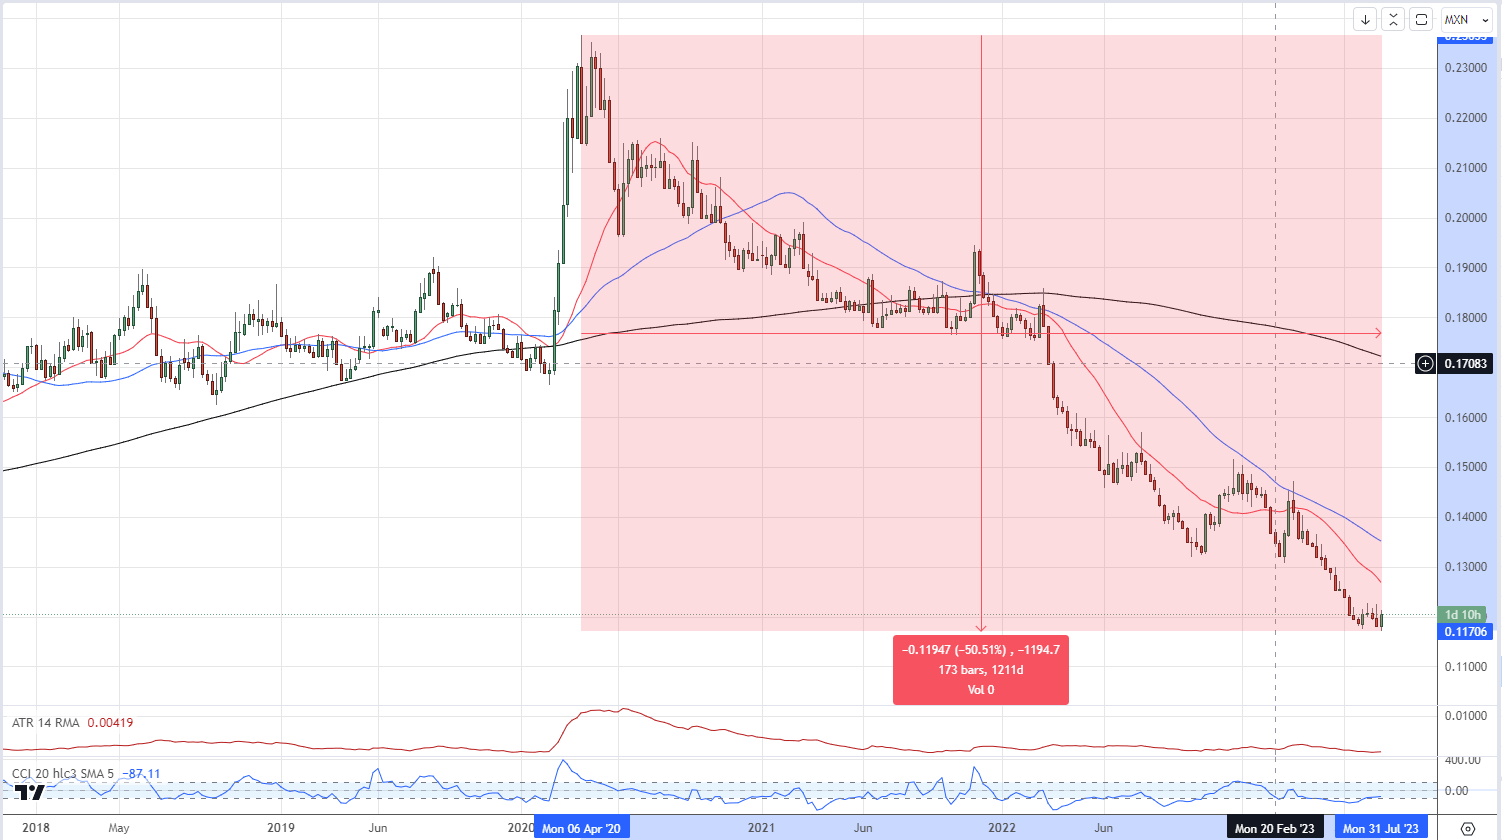
Another pair to show the strength of this rate-differential is JPY/MXN with the high-yielding Mexican Peso appreciating by over 50% (high to low) against the low-yielding Japanese Yen. While the Mexican central bank has been hiking rates ever higher, the Bank of Japan has left its borrowing rate at ultra-low levels in an effort to boost inflation. The widening interest rate differential between the two currencies has seen JPY/MXN on a one-way path over the last 3+ years. As long as the Bank of Japan stays put on monetary policy, JPY/MXN will struggle to break higher.
JPY/MXN Weekly Price Chart – August 3, 2023
Charts via TradingView
What is your view on the Mexican Peso – bullish or bearish?? You can let us know via the form at the end of this piece or you can contact the author via Twitter @nickcawley1.


