


USD, CNH, US Dollar, Chinese Yuan, USD/CNH - Technical Outlook:
- USD/CNH has failed to break above major long-term resistance
- The fall below key support is an indication that USD/CNH’s rally has stalled for now
- What is the outlook and what are the key levels to watch?

USD/CNH SHORT-TERM TECHNICAL FORECAST – NEUTRAL
The Chinese yuan’s rise above key resistance against the US Dollar seems like confirmation that downward pressure on the Chinese currency has faded in the interim.
USD/CNH 240-minutes Chart
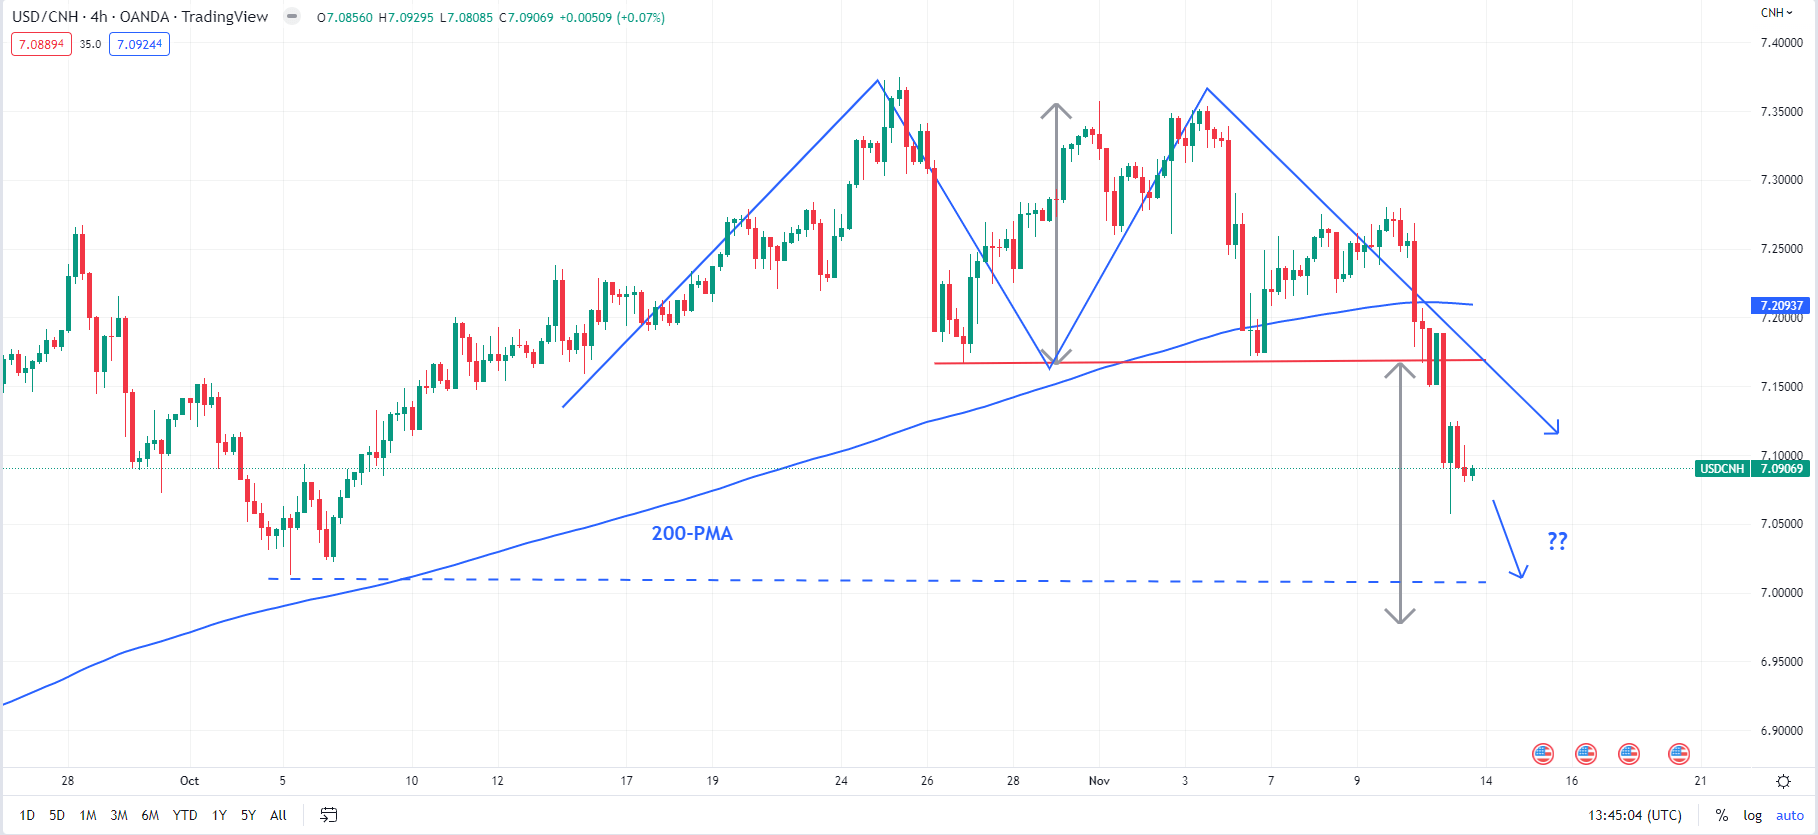
Chart Created Using TradingView
USD/CNH has fallen below quite a strong cushion at the October 27 low of 7.17, near the 200-period moving average on the 240-minute charts. It rebounded last week from this barrier but failed to cross above the mid-point of a slightly downward-sloping channel from the end of October (at about 7.25) –a path that was highlighted in the previous update. The bearish break has triggered a Double Top pattern (at the October and early-November highs), opening the way toward the October low of 7.01 (see chart above).
USD/CNH Monthly Chart
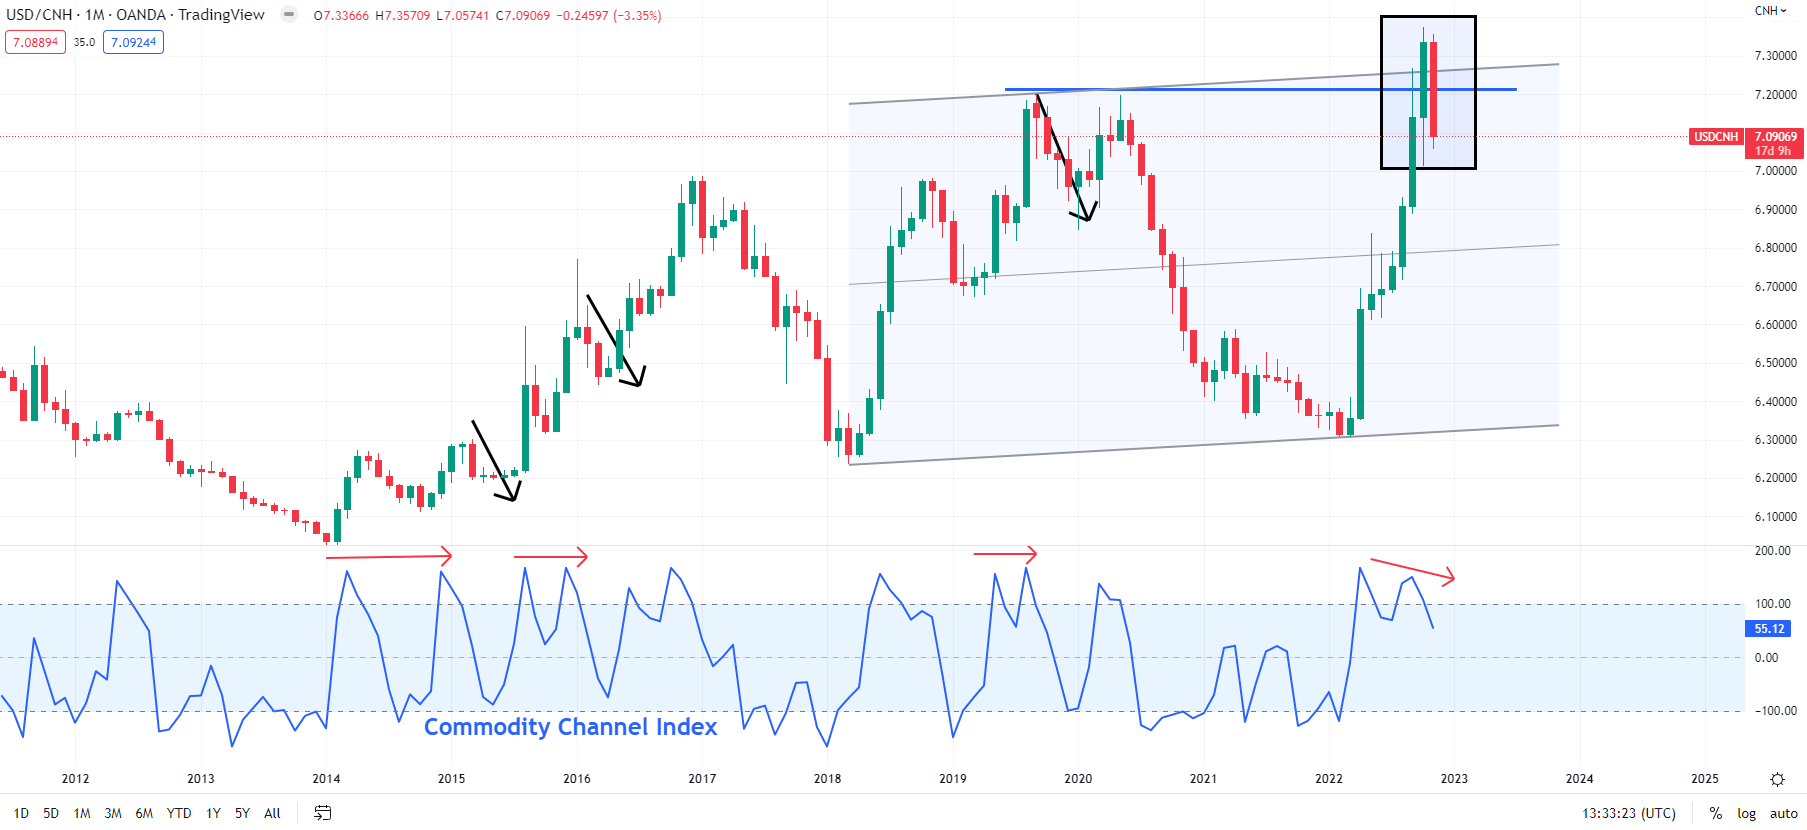
Chart Created Using TradingView
A month ago, I pointed out the risk of a pause in the USD/CNH bull run. At that time, the pair briefly rose above a major hurdle at 7.20, where the 2019 and 2020 highs coincided with the upper edge of a slightly upward-sloping channel from 2018 (see chart above). At the same time, negative divergence (rising price associated with stalling or weakening momentum) on the monthly, weekly, and daily charts indicated that the seven-month-long rally was showing signs of fatigue.
USD/CNH Daily Chart
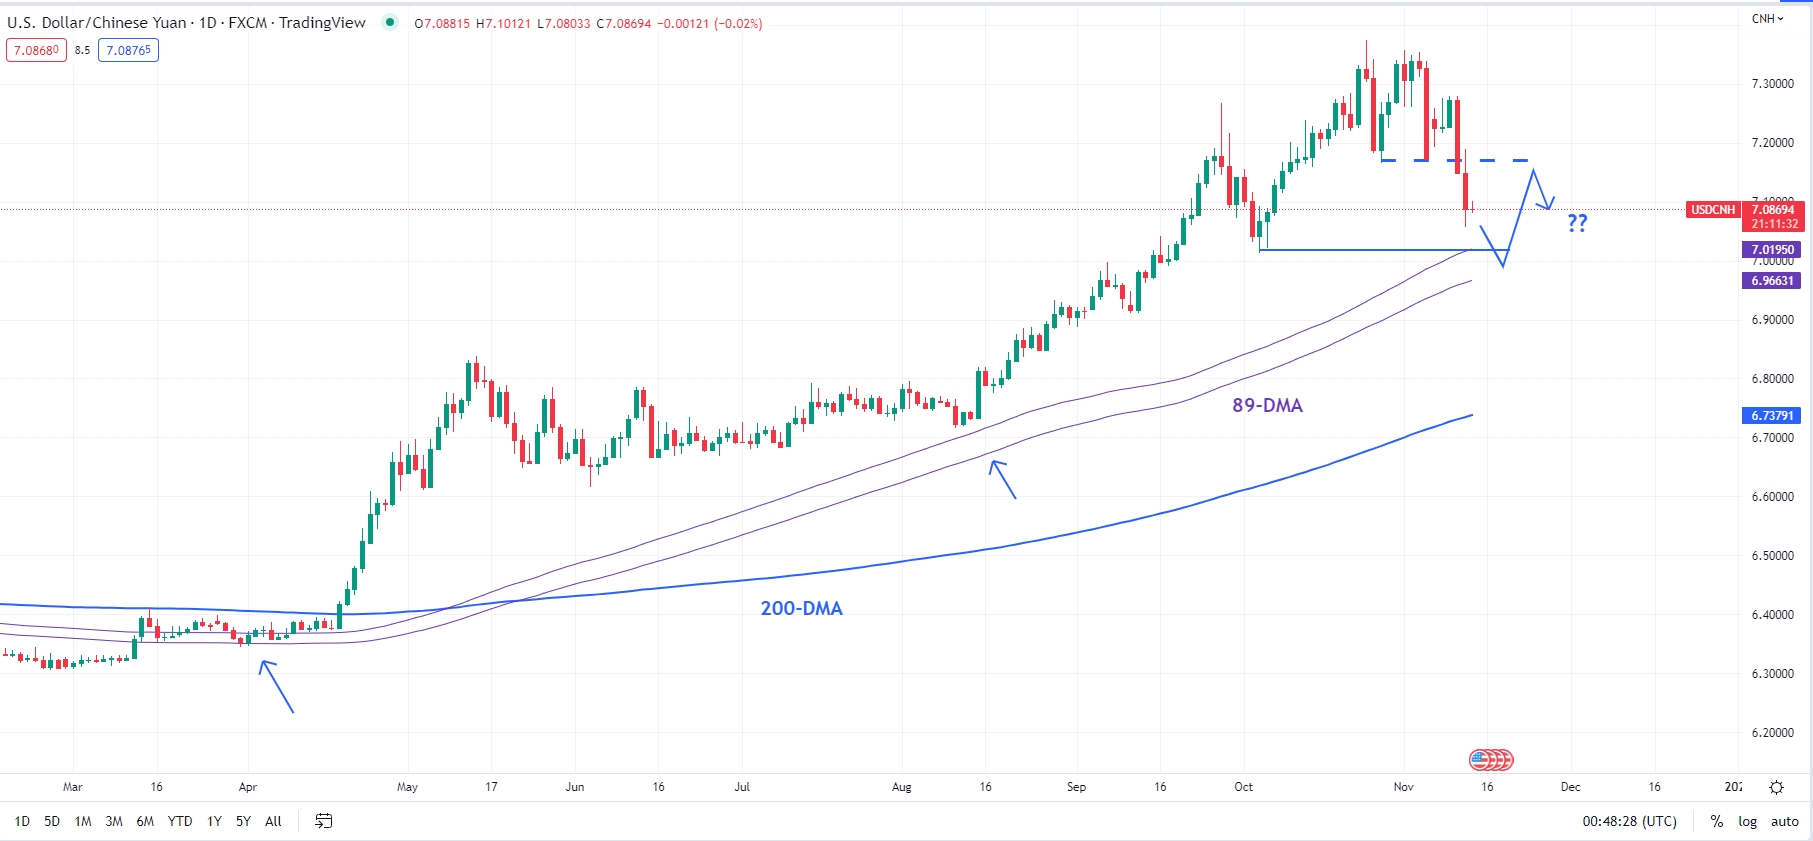
Chart Created Using TradingView
Zooming in on the daily charts, the floor at 7.01 is reinforced at the 89-day moving average (now at about 7.00), which hasn’t been broken since the USD/CNH rally began earlier this year. Hence, some sort of a rebound from around 7.00-7.01 wouldn’t be surprising. However, any such move could encounter stiff resistance marked by former support at 7.17. Still, upward momentum on longer-term charts, including the weekly and the monthly charts, remains strong (despite the recent drop in USD/CNH), so any retreat could be limited.

--- Written by Manish Jaradi, Strategist for DailyFX.com


