


USD, CNH, US Dollar, Chinese Yuan, USD/CNH - Technical Outlook:
- USD/CNH is testing major resistance
- The rally is showing signs of fatigue
- What is the outlook and what are the key levels to watch?

USD/CNH SHORT-TERM TECHNICAL FORECAST – NEUTRAL
The Chinese Yuan’s (CNH) slide against the US Dollar is showing signs of fatigue after hitting a record closing high on a weekly basis near major resistance.
Last week, USD/CNH closed above major resistance on the 2019 and 2020 highs at 7.1965, coinciding with the upper edge of a slightly upward-sloping channel from 2018. Given the pace and the extent of the rise since March, some consolidation or a minor retreat can’t be ruled out. Moreover, negative divergence (rising price associated with stalling or weakening momentum) on the monthly, the weekly and the daily charts indicates that the rally is showing signs of fatigue (see chart).
USD/CNH Monthly Chart
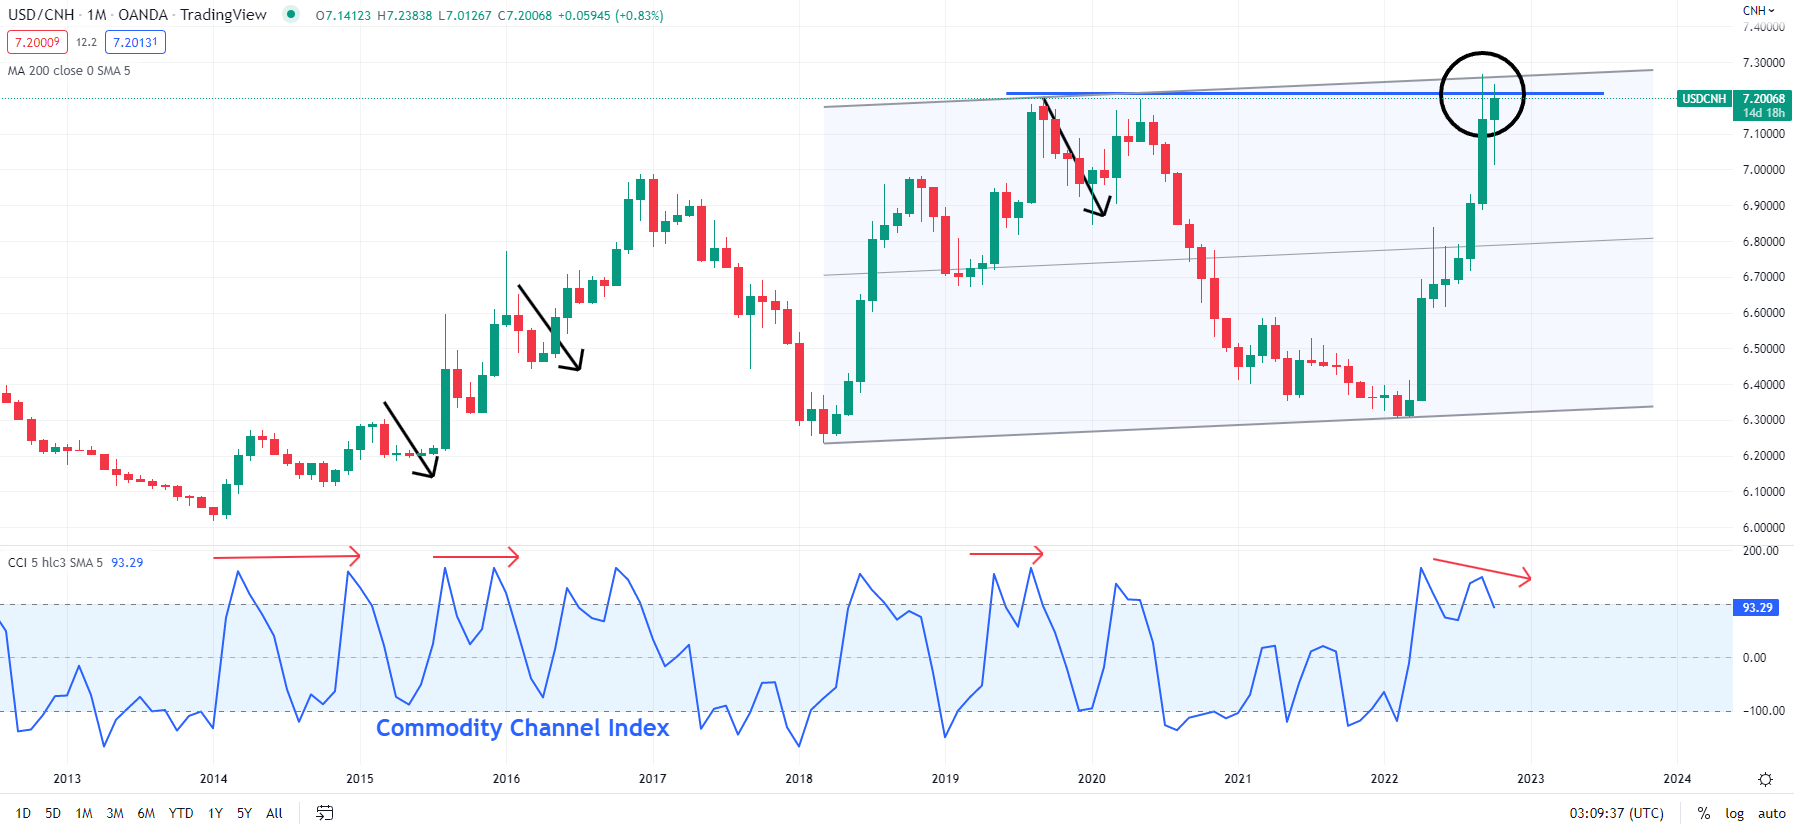
Chart Created Using TradingView
While the slowdown in upward momentum is not a sufficient condition to ensure a trend reversal, it raises the prospect of a short-term pause in the rally. Indeed, if history is any guide, the case for a further rise in USD/CNH over the medium term remains intact, but the major resistance coupled with negative divergence means that USD/CNH may need to consolidate before the next leg higher.
As the below chart shows, since last year there have been two instances where USD/CNH’s rally has stalled following negative divergence on the daily charts. On both occasions, the stalling in momentum – the Moving Average Convergence Divergence (MACD) Histogram, which measures the distance between the MACD and its signal line, the 9-period exponential moving average of the MACD – was a warning sign of a change in the trend. Red bars indicate weak momentum, while green bars indicate strong in momentum. USD/CNH subsequently went sideways for weeks.

USD/CNH Daily Chart
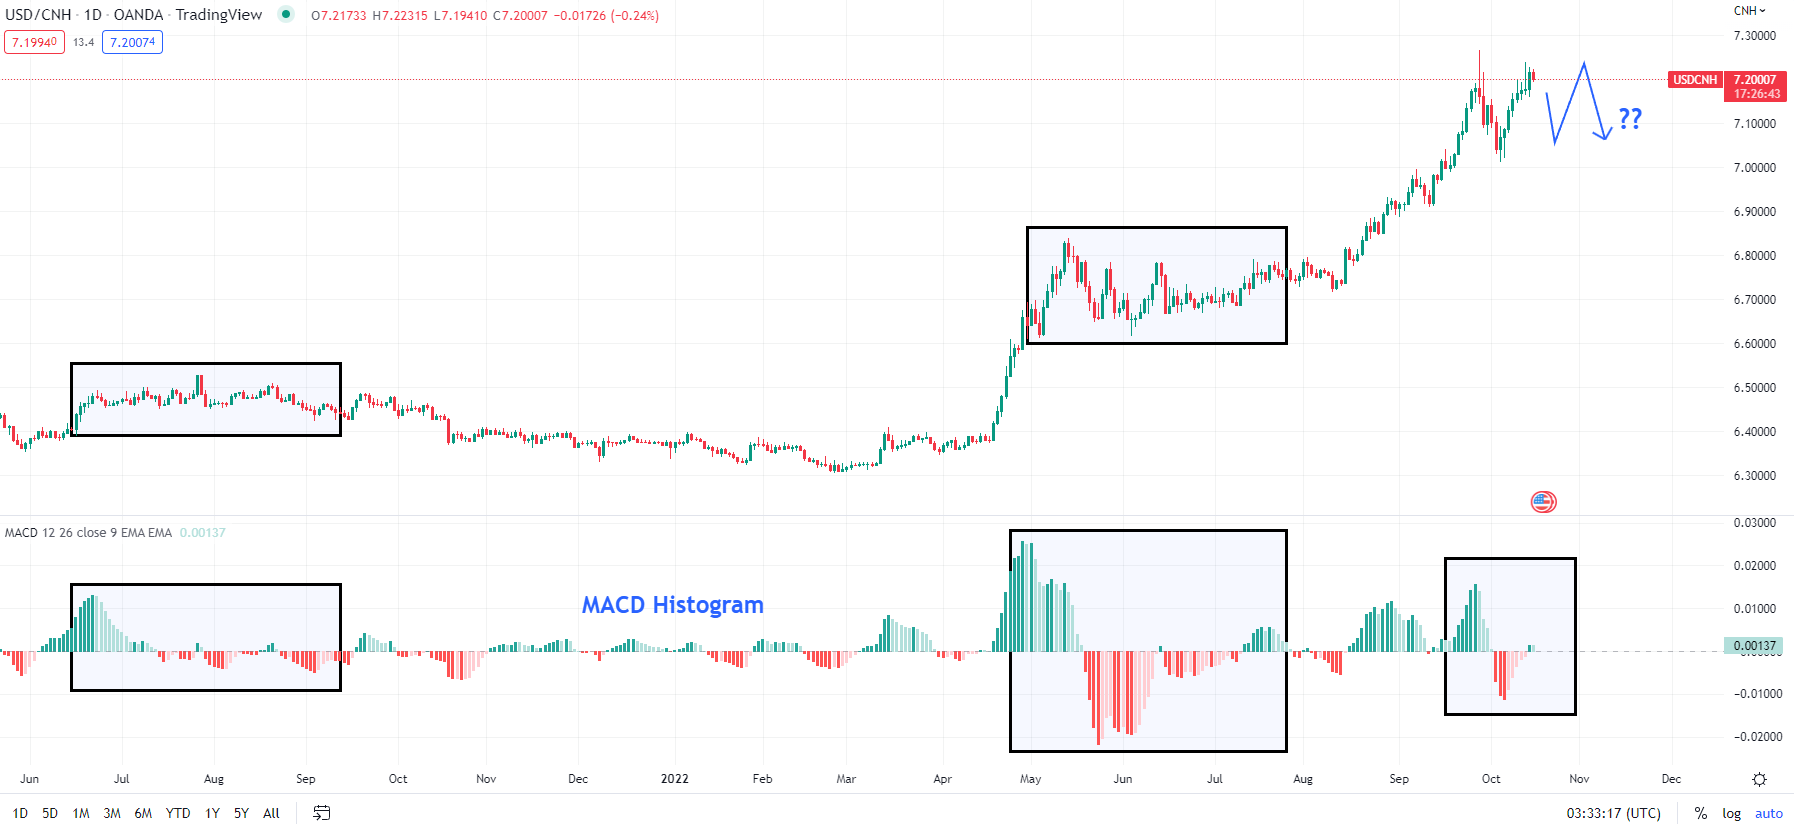
Chart Created Using TradingView
This time around, the MACD Histogram is barely in the green even though the pair closed at a record high last week on the weekly chart. However, there is no sign of reversal of the USD/CNH uptrend. In this regard, Friday’s low at 7.1580 is immediate support. Any break below would be a signal that the uptrend was beginning to stall in the short term. However, the downside could be cushioned around strong support at the October 5 low of 7.0115.
--- Written by Manish Jaradi, Strategist for DailyFX.com


