


US Dollar, Australian Dollar, Japanese Yen, Euro, British Pound – Price Action Setups:
- US Dollar showing increasing bullish technical signals
- AUD/USD and EUR/USD face Rising Wedge breakouts
- USD/JPY downtrend breaks, GBP/USD Double Top eyed

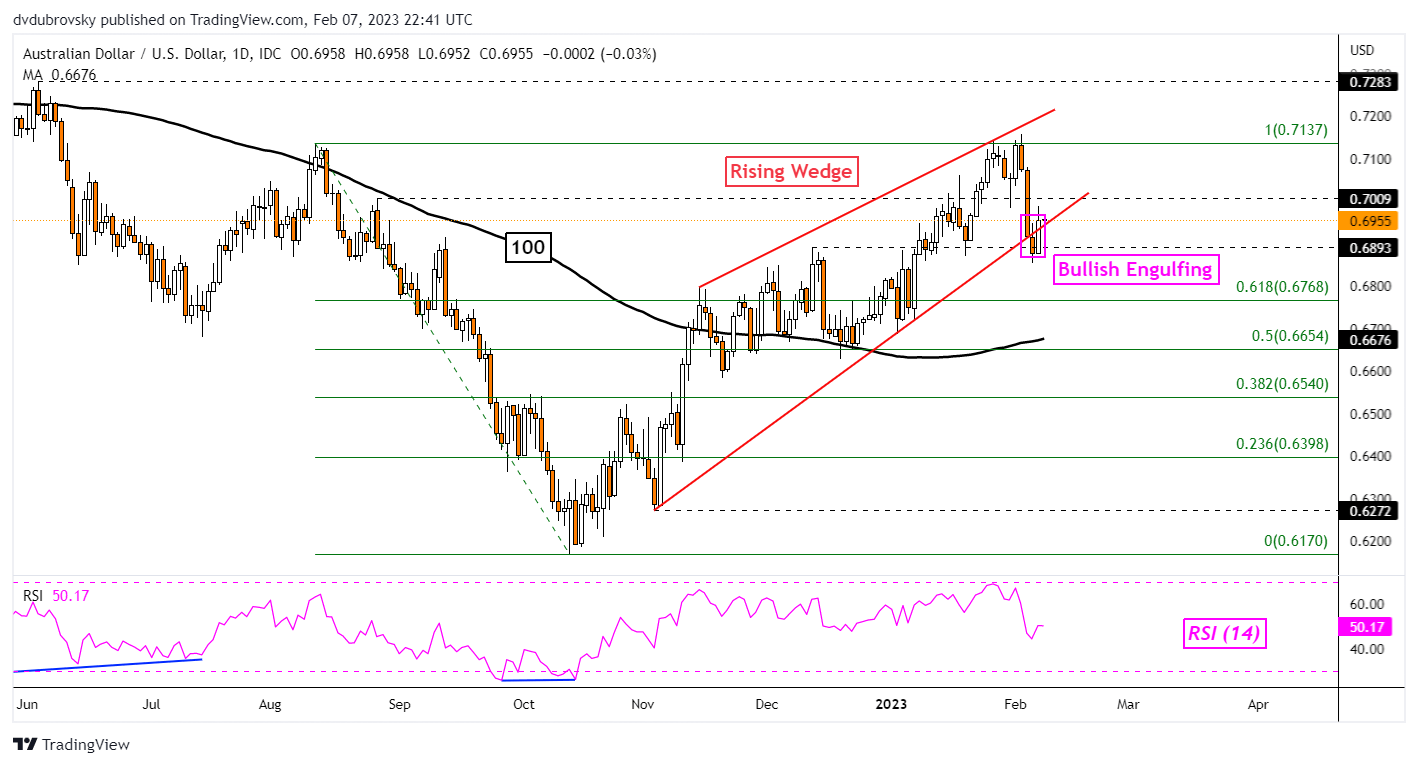
AUD/USD Daily Chart – Bullish Engulfing and Rising Wedge
The Australian Dollar is attempting to make a comeback against the US Dollar. AUD/USD broke under a bearish Rising Wedge chart formation on Monday. 24 hours later, the pair turned higher and left behind a Bullish Engulfing candlestick pattern. This is a sign that the bulls aren’t quite ready to give up just yet. Follow-through will be key in the remaining trading sessions this week. An upside push from here could maintain the bullish posture since November. Otherwise, confirming a breakout under the wedge would offer an increasingly bearish outlook.
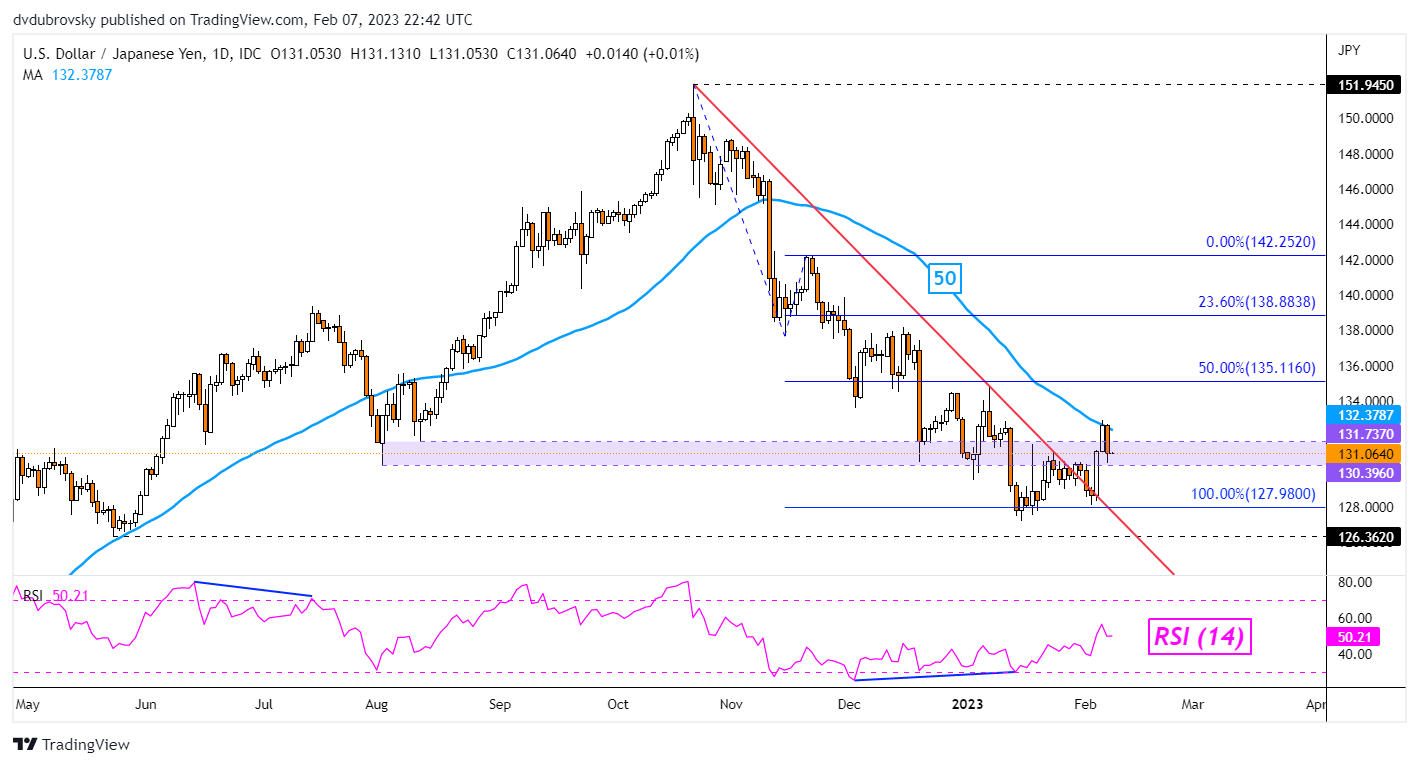
USD/JPY Daily Chart – Trendline Breakout Hits a Snag
On Monday, the US Dollar closed at its highest against the Japanese Yen in about one month. That pushed USD/JPY further above a key falling trendline from October, opening the door to a broader reversal. But, the 50-day Simple Moving Average kicked in and held as resistance. That is undermining the breakout. A confirmatory push above the 50-day SMA would likely shift the focus back to the upside. Key support is around 127.98. As for resistance, the midpoint of the Fibonacci extension at 135.116 would be a key contender.
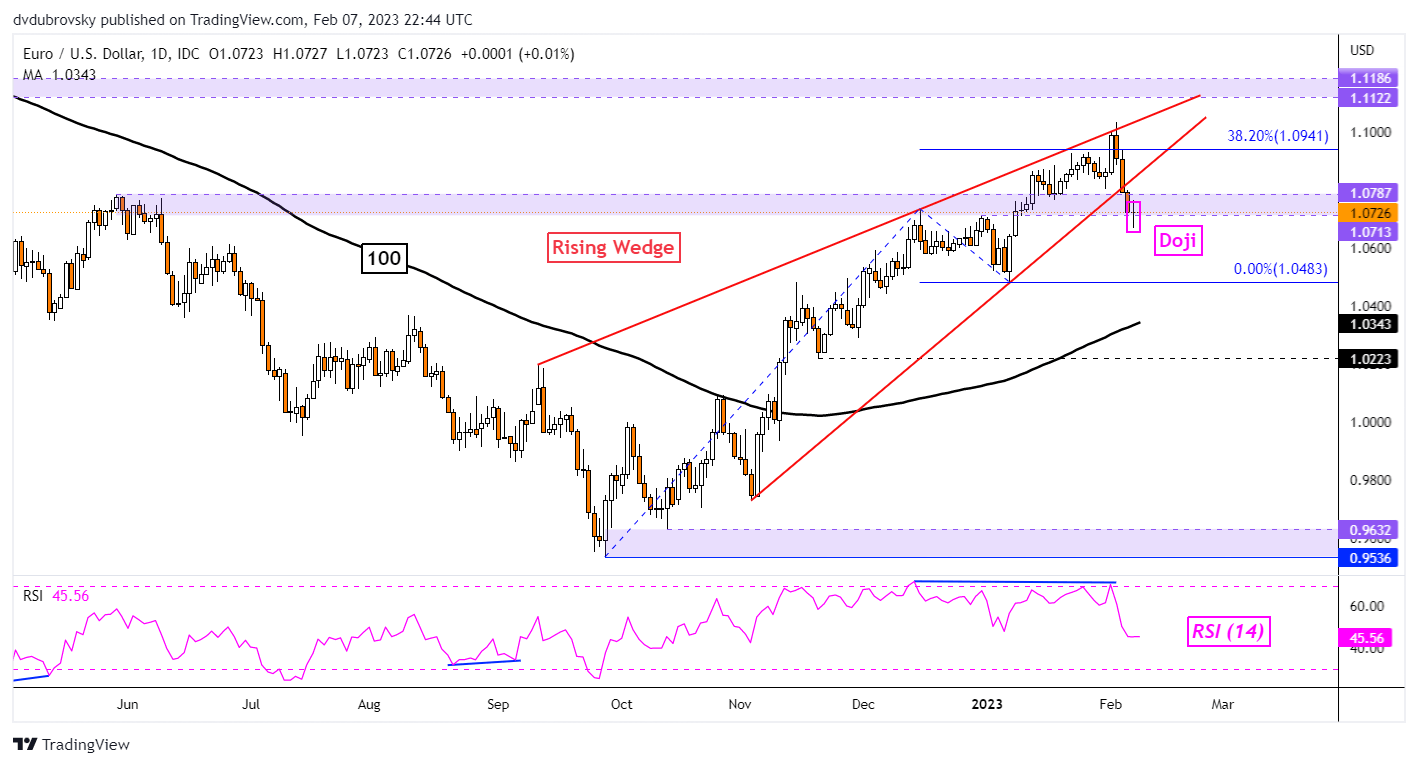
EUR/USD Daily Chart – Rising Wedge Breakout and Doji
The US Dollar may be readying to extend gains against the Euro. That is because EUR/USD confirmed a breakout under a bearish Rising Wedge. Yet, on Tuesday prices left behind a Doji candlestick pattern. The latter is a sign of indecision. Upside follow-through after the Doji may undermine the wedge breakout, placing the focus on the floor of the wedge. It may hold as new resistance, pivoting prices lower. Extending losses places the focus on the January low at 1.0483.

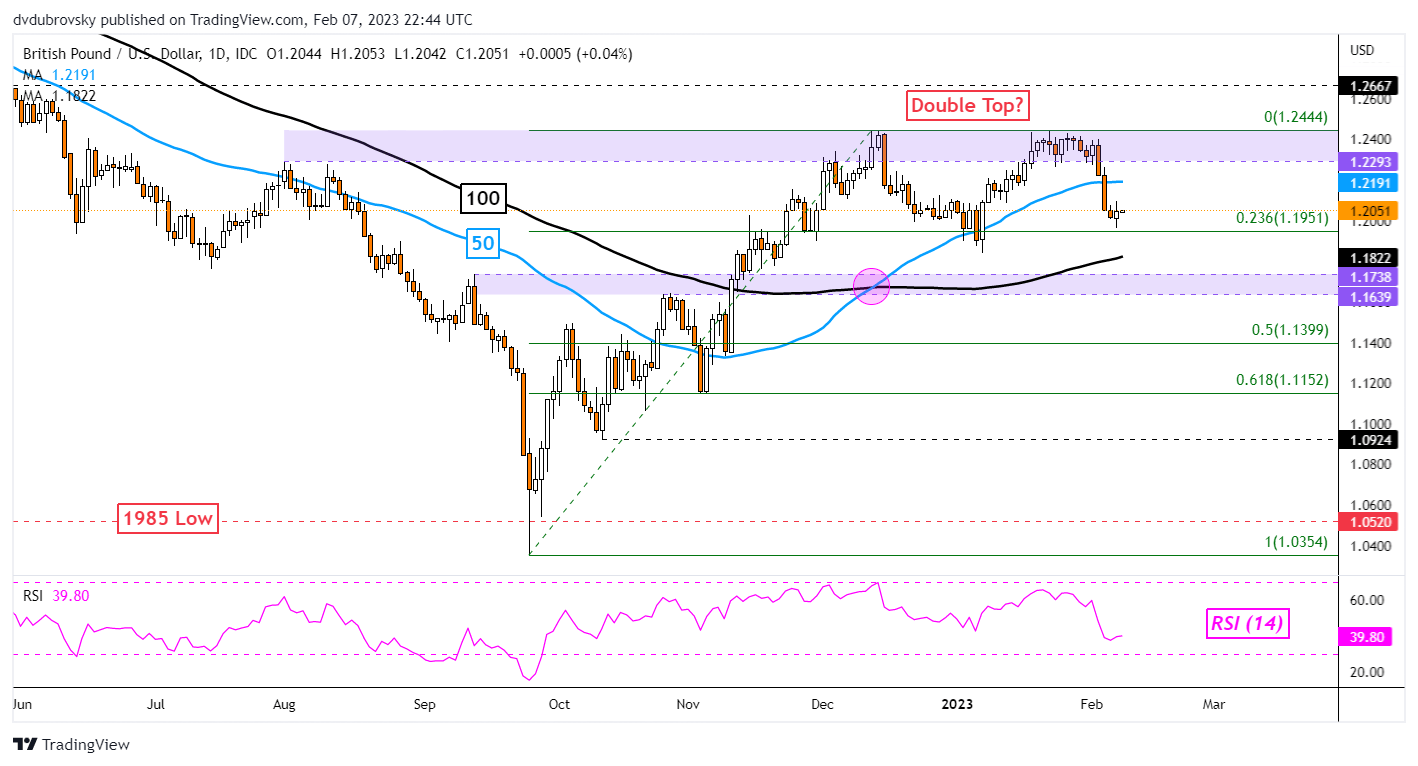
GBP/USD Daily Chart – Double Top Neckline in Focus
The US Dollar is facing its next key test against the British Pound. After a few days of losses, GBP/USD finds itself sitting on the neckline of a bearish Double Top chart formation. Clearing this point, which seems to be sitting around 1.1951, would open the door to extending losses toward the 1.1639 – 1.1738 inflection zone. Getting there entails clearing the 100-day SMA, which may hold as support and maintain the upside focus. Pivoting higher from here on the other hand may open the door to revisiting the 1.2293 – 1.2444 resistance zone.
--- Written by Daniel Dubrovsky, Strategist for DailyFX.com
To contact Daniel, use the comments section below or@ddubrovskyFXon Twitter


