


UK FTSE Index, UKK, FTSE 100 Index - Technical Outlook:
- FTSE is attempting to break above crucial resistance.
- Breadth market data and charts suggests that the index has scope to rise further.
- Where is the index headed?

FTSE TECHNICAL FORECAST – BULLISH
Technical charts and breadth market data suggest that the UK FTSE 100 index may have scope to rise further in the coming weeks/months.
As of Wednesday, 90% of the members in the UK FTSE 100 index are above their respective 100-day moving averages (DMAs), not too far from 92% a week ago. Data from 2002 onwards suggests that when 92% of the members were above their respective 100-DMAs, the index has been up 63% of the time over the subsequent 60 days (see distribution plot of returns).
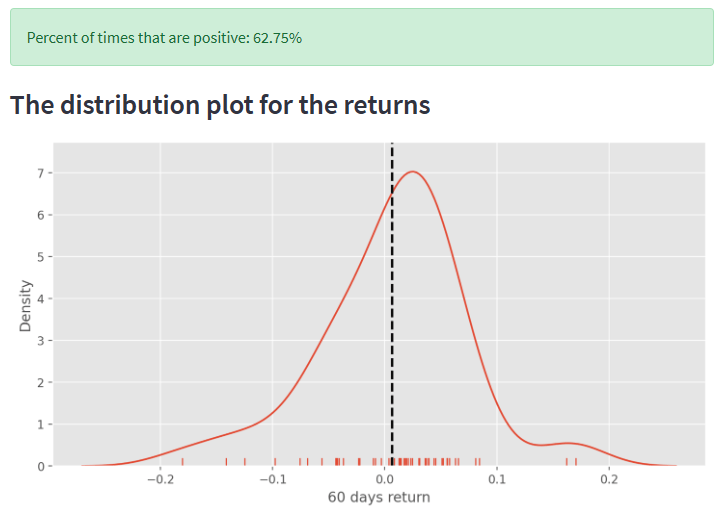
Data Source: Bloomberg; Chart Created by Manish Jaradi Using Python. The author does not guarantee the accuracy of the information. Past performance is not indicative of future performance. Users of the information do so at their own risk.
On technical charts, the index, up over 18% from October, is attempting to break above crucial resistance at the 2018 highs of 7790-7805. A decisive break above could pave the way toward the upper edge of a rising channel from 2003 (now at about 8300).
FTSE INDEX Monthly Chart
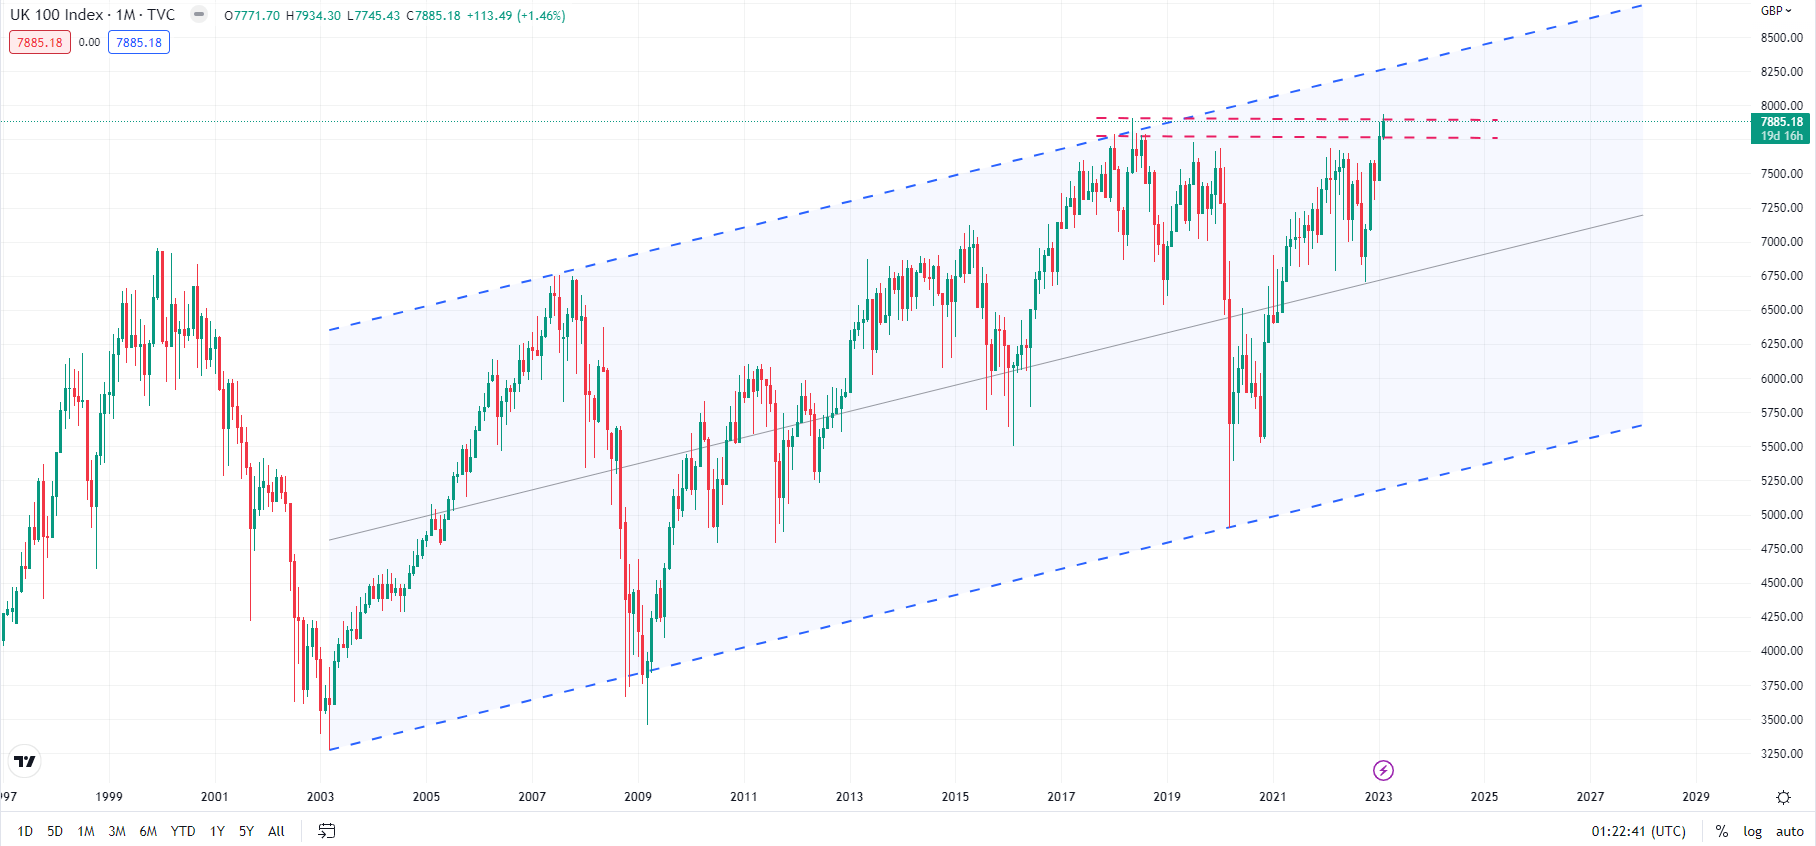
Chart Created by Manish Jaradi Using TradingView
A more bullish perspective would be the potential target of the reverse head & shoulders pattern (the left shoulder at the 2018 low, the head at the 2020 low, the right shoulder at the 2022 low) pointing to roughly 30% upside from current levels in coming months/years. In a way, it wouldn’t be surprising given that the index has been essentially sideways for the past two decades.
FTSE INDEX Daily Chart
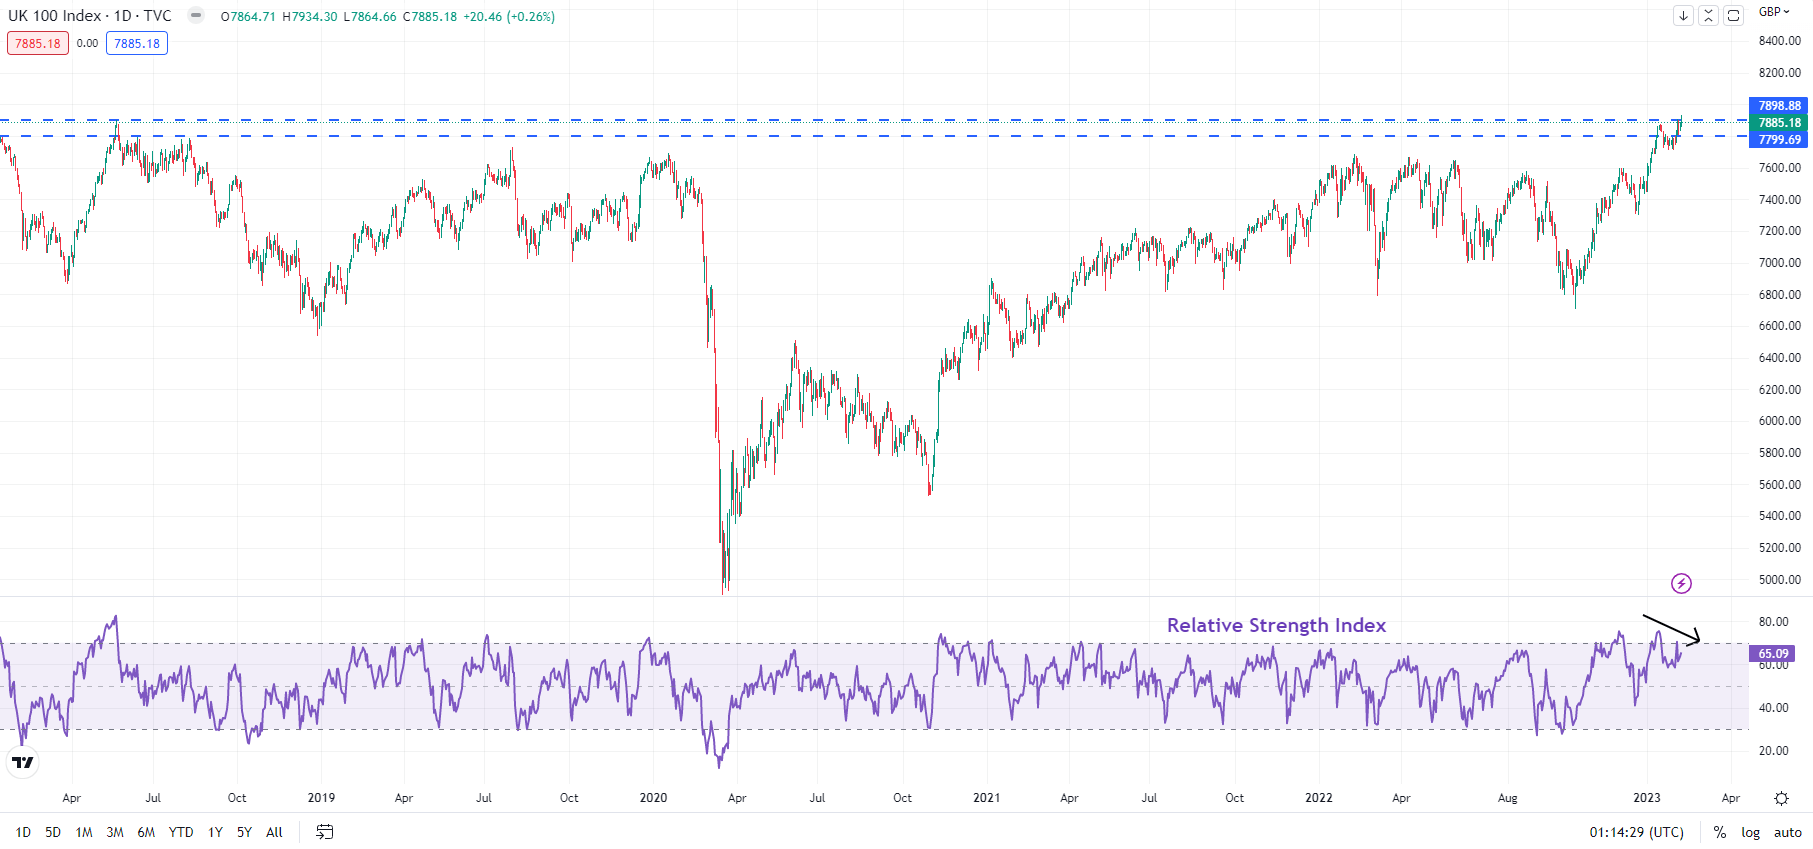
Chart Created by Manish Jaradi Using TradingView
As of now, the break of a series of resistance zones in recent weeks confirms that the trend is bullish. However, a negative divergence on the daily charts of the FTSE 100 index indicates that the rally is showing some signs of fatigue. A pause/minor retreat can’t be ruled out in the near term. There is quite strong support at the January low of 7708, which could contain the downside. Stronger support is at the November high of 7600.
--- Written by Manish Jaradi, Strategist for DailyFX.com


