


S&P 500, Euro Stoxx 50, UK FTSE 100 - Price Outlook:
- 94% of the members in the S&P 500 index are above their respective 10-DMAs.
- 98% of the members in the Euro Stoxx 50 index are above their respective 10-DMAs.
- 91% of the members in the UK FTSE 100 index are above their respective 10-DMAs.

Improving market breadth points to further gains in the S&P 500, the UK FTSE 100, and the Euro Stoxx 50 index in the coming weeks, at least based on their historical performance.
As of Thursday, 94% of the members in the S&P 500 index were above their respective 10-day moving averages (DMA), just as the index appears to be setting the stage for a meaningful rebound. Data from 1996 onwards suggests that when 93%-94% of the members were above their respective 10-DMAs, the index has been up 71% of the time over the subsequent 30 days (the distribution plot on the right panel; note a five-month gap is maintained between two readings).
Distribution plot of S&P 500 index returns
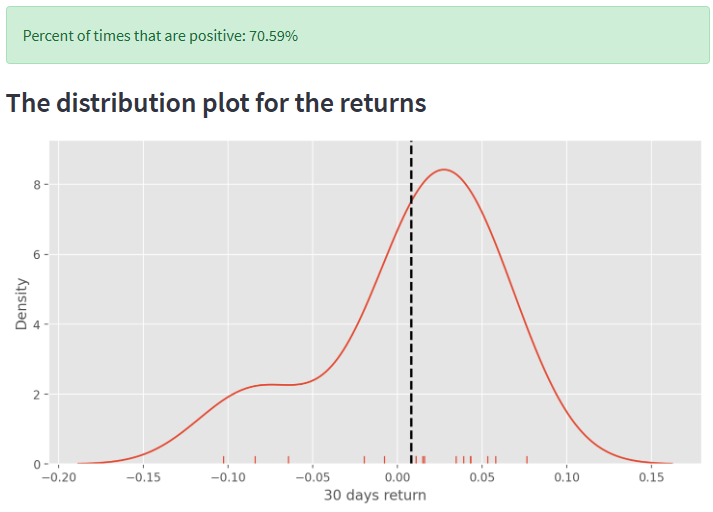
Data Source: Bloomberg; Chart Created by Manish Jaradi in Python
As of Thursday, 98% of the members in the Euro Stoxx 50 index were above their respective 10-day moving averages. Data from 2002 onwards suggests that when 97%-98% of the members were above their respective 10-DMAs, the index has been up 61% of the time over the subsequent 30 days (the distribution plot on the right panel; note a five-month gap is maintained between two readings).
Distribution plot of Euro Stoxx 50 index returns
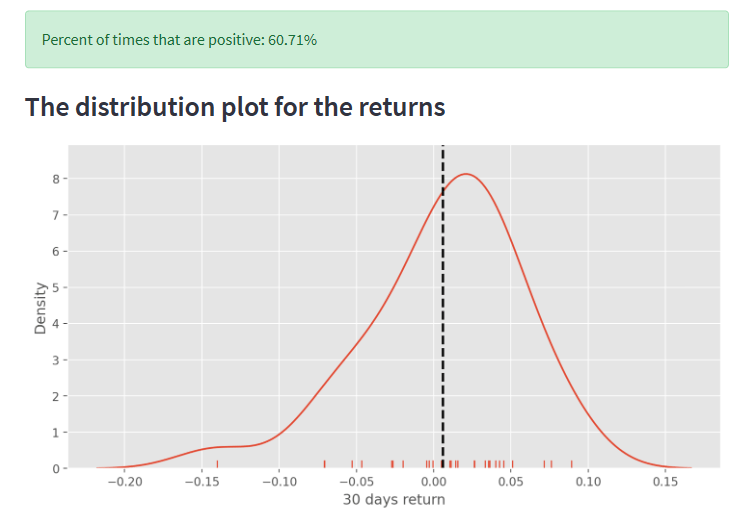
Data Source: Bloomberg; Chart Created by Manish Jaradi in Python
As of Thursday, 91% of the members in the UK FTSE 100 index were above their respective 10-day moving averages. Data from 2002 onwards suggests that when 91%-92% of the members were above their respective 10-DMAs, the index has been up 69% of the time over the subsequent 30 days (the distribution plot on the right panel; note a five-month gap is maintained between two readings).
Distribution plot of UK FTSE 100 index returns
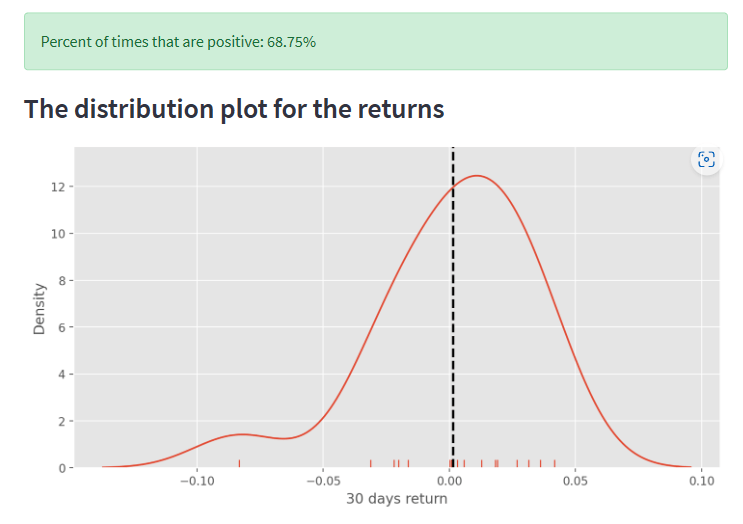
Data Source: Bloomberg; Chart Created by Manish Jaradi in Python
Trade Smarter - Sign up for the DailyFX Newsletter
Receive timely and compelling market commentary from the DailyFX team
--- Written by Manish Jaradi, Strategist for DailyFX.com
--- Contact and follow Jaradi on Twitter: @JaradiManish


