


U.S. Indices Technical Outlook:
- S&P 500 nearing lows, looks necessary to break and capitulate for a bottom
- Nasdaq 100 11k mark poised to be broken in coming weeks
- Dow Jones levels and lines to watch in days ahead

S&P 500, Dow Jones, Nasdaq 100 Outlook: New Lows and Fear Needed for Bottom
As the market continues to decline in bear market fashion towards the June lows during the seasonally worst period of the year it becomes increasingly likely that we are on the verge of an acceleration in selling and spike in the VIX.
A spike in the VIX (fear) and capitulation in stocks is often what is needed to put a low in for stocks, whether the low will be intermediate-term in nature such as the summer low or whether it is a long-term low that leads to a new bull market is yet to be seen.
I’m of the mind that we may see something a bit more dramatic than what we saw in the summer that leads to a sustainable rally for a while, but not necessarily what the market needs to put in the low. But that again all depends on how this current bout of weakness plays out.
If we see a marginal new low, say 3500 or 3400 in the S&P, then it is likely we see a VIX spike to around 40 or a little higher, and it is viewed as creating a solid tradeable low that leads to an end of year rally. If, however, we see the market come completely unglued this fall and the market drops to say, under 3000 with a massive spike in the VIX to the 50s or 60s, then the low could be a lot more meaningful.
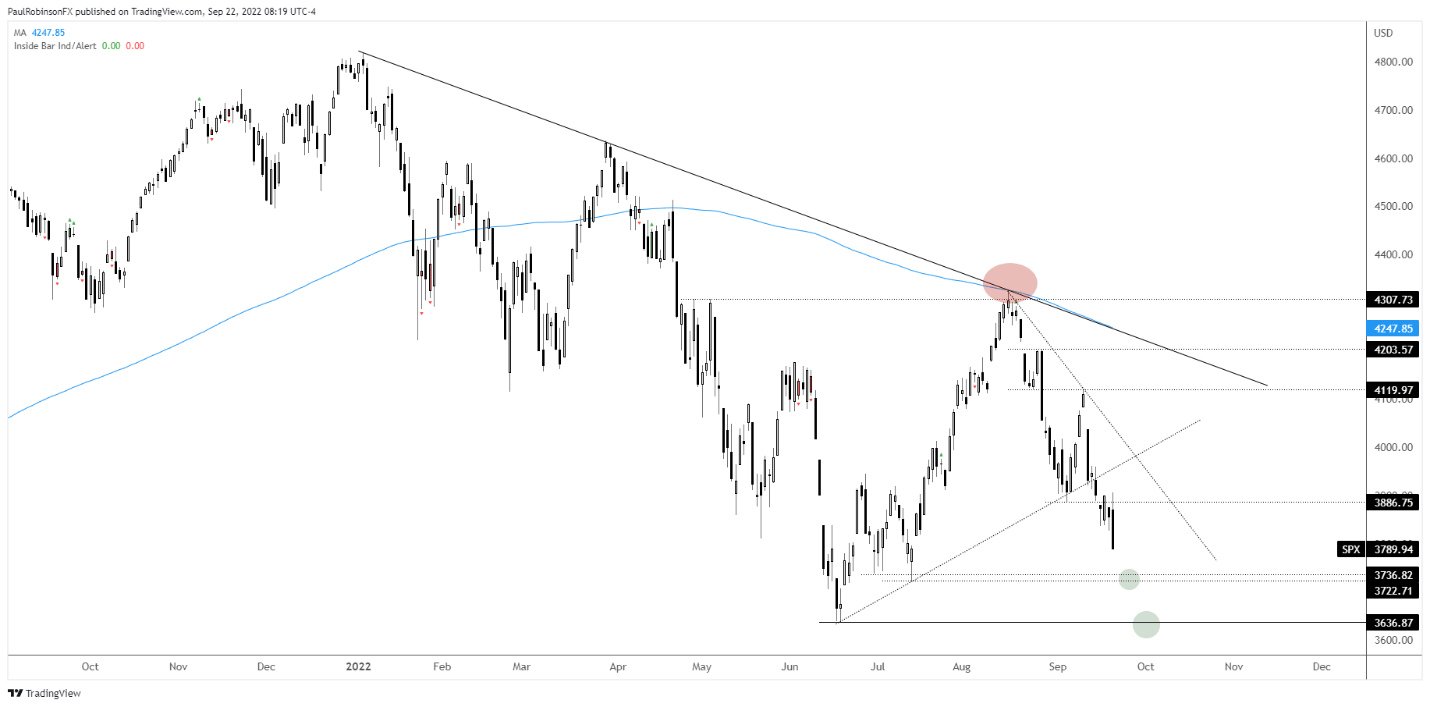
The bottom line is the longer we see the market continue to go down without major selling/fear attached to the selling, the longer the bear market is likely to last. Taking it one step at a time, first thing is first, the SPX low at 3636 is in focus.
We may see a bounce before we break the low, markets don’t go straight down (or up). On a near-term bounce watch the zone around 3886/907 as resistance, with the possibility that the August trend-line as the high point of any rally we may see from here.
There is some support to watch around 3736/22, but this isn’t expected to be all that meaningful as we appear to be near the point of acceleration once we get to the summer lows. We may see a bounce around the June low, but again it is expected to be very short-lived.

S&P 500 Daily Chart
The Nasdaq 100 is looking to the 11492/321 area as the next point of support, with the summer low at 11037 as the bigger level in focus. A bounce may see the 11928 up to 12063 area tested, but price is not excepted to rise above that point.
Nasdaq 100 Daily Chart
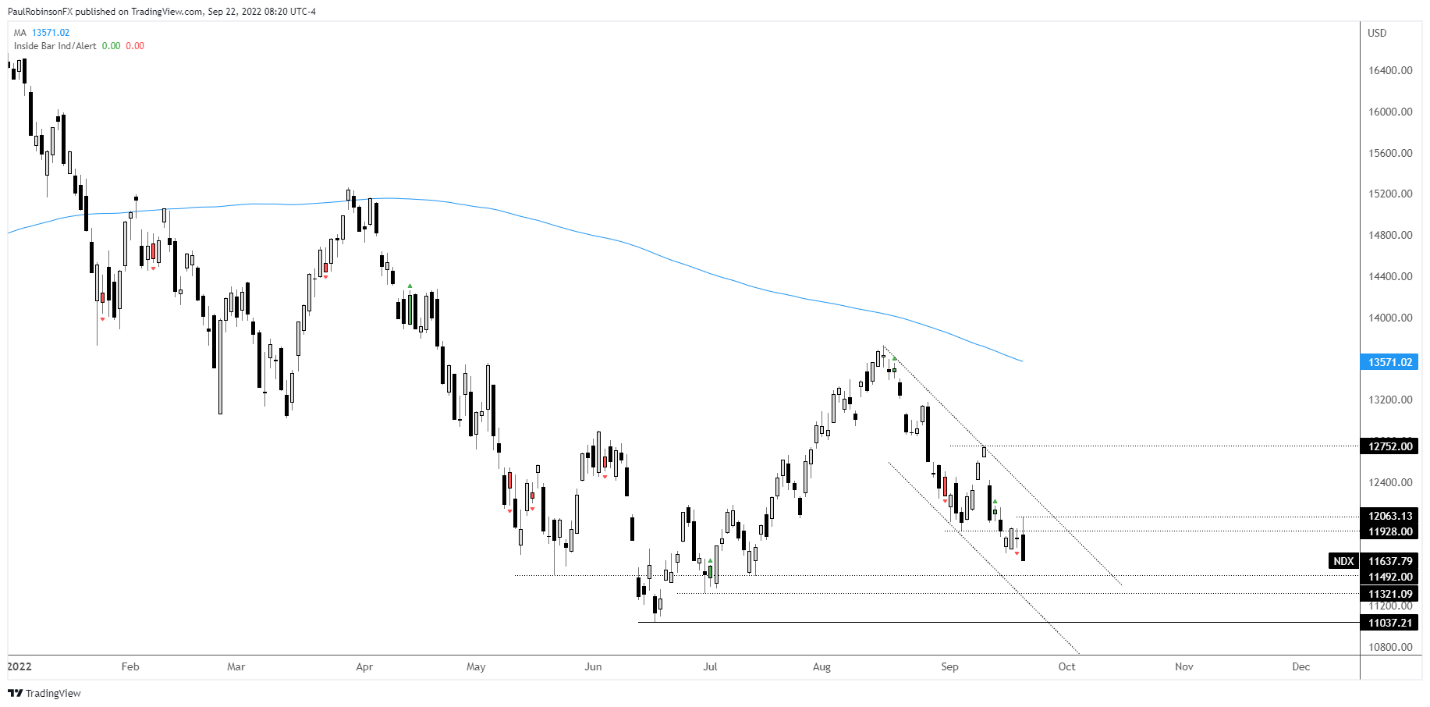
Nasdaq 100 Chart by TradingView
TheDow Jonesonly has a short distance to go before it makes a new under 29653, which will very quickly bring into focus the pre-covid high at 29568. We may se a bounce around here, but again it is seen as likely a meaningful lower low will develop. On a bounce the area around 31048 is seen as resistance.
Dow Jones Daily Chart
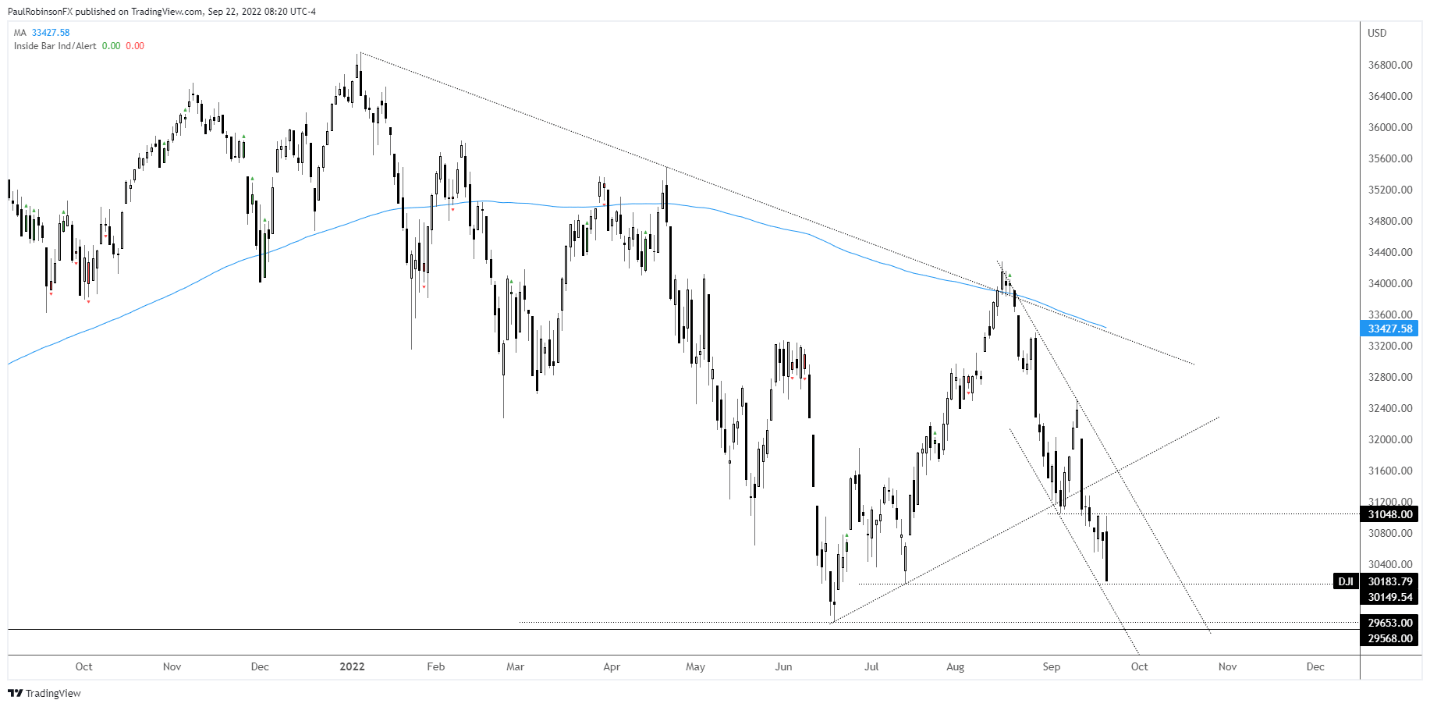
Dow Jones Chart by TradingView
Resources for Forex Traders
Whether you are a new or experienced trader, we have several resources available to helpyou;indicator for trackingtrader sentiment, quarterlytrading forecasts, analytical and educationalwebinarsheld daily,trading guidesto help you improve trading performance, and one specifically for those who arenew to forex.
---Written by Paul Robinson, Market Analyst
You can follow Paul on Twitter at @PaulRobinsonFX


