


U.S. Indices Technical Outlook:
- S&P 500 bouncing after taking out June low
- Bounce is all that is expected to be, but could rise sharply before it ends
- S&P 500, Nasdaq 100, Dow Jones technical outlook

S&P 500, Dow Jones, Nasdaq 100 Outlook: Bounce May Unfold, but Short-lived
Stocks are coming off the lows in sharp fashion after taking out the summer low, with the S&P 500, Nasdaq 100, and Dow Jones having all taken out their respective levels. The rally in futures has been fierce the last 24 hours, and these types of rallies are to be expected in a bear market.
While there was some stress and panicky price action in the FX and bond markets, we haven’t seen what I would consider any capitulation out of stocks. Panic is minimal even if bearishness is high. The generally orderly decline suggests we have yet hit a really rough period for equities.
The rally could last a little while longer or it could end today. Bear market bounces are typically highlighted by strong “out of the clear blue” surges that draw in fresh buyers thinking the low is in and send shorts scrambling for cover.
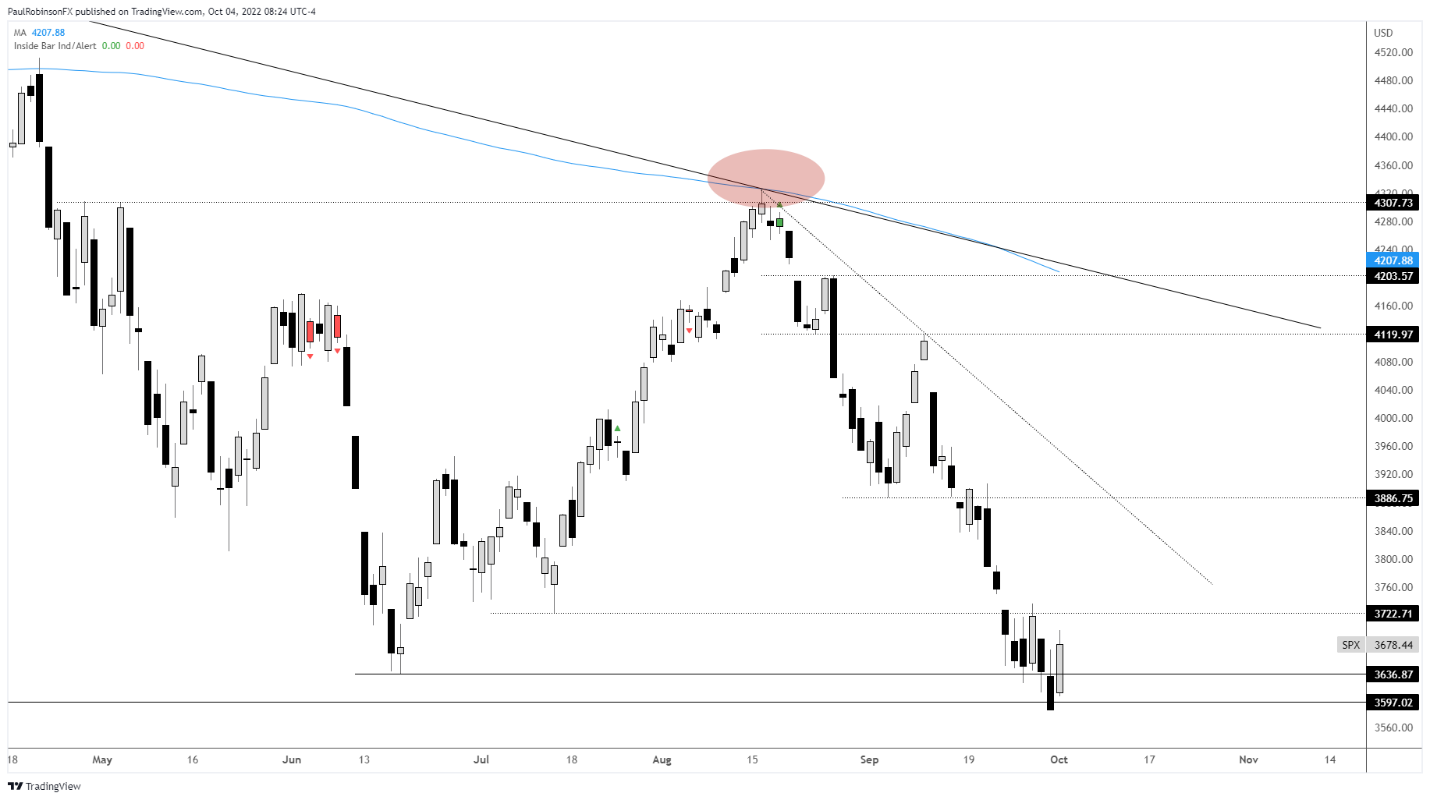
There is initial resistance around 3640 area, but if that don’t hold then we may have to look up towards the trend-line running down off the summer highs and perhaps even as high as 3886 before the bounce runs out of steam.
On the downside a break below 3584 is needed to get things running lower again. If the decline continues to be orderly then each rally will be viewed with heavy skepticism. If, however, we get a cascade in price action with a strong spike in the VIX, then a low could soon come that will lead to a more sustainable rally.

S&P 500 Daily Chart
The Nasdaq 100 cleared the summer low Friday before this bounce, not an unusual occurrence. New lows are often made only to be cleared away by a strong rally. There is resistance around 11492, then the channel line off the summer high, which is closer to 11650/700 area at this time.
Nasdaq 100 Daily Chart
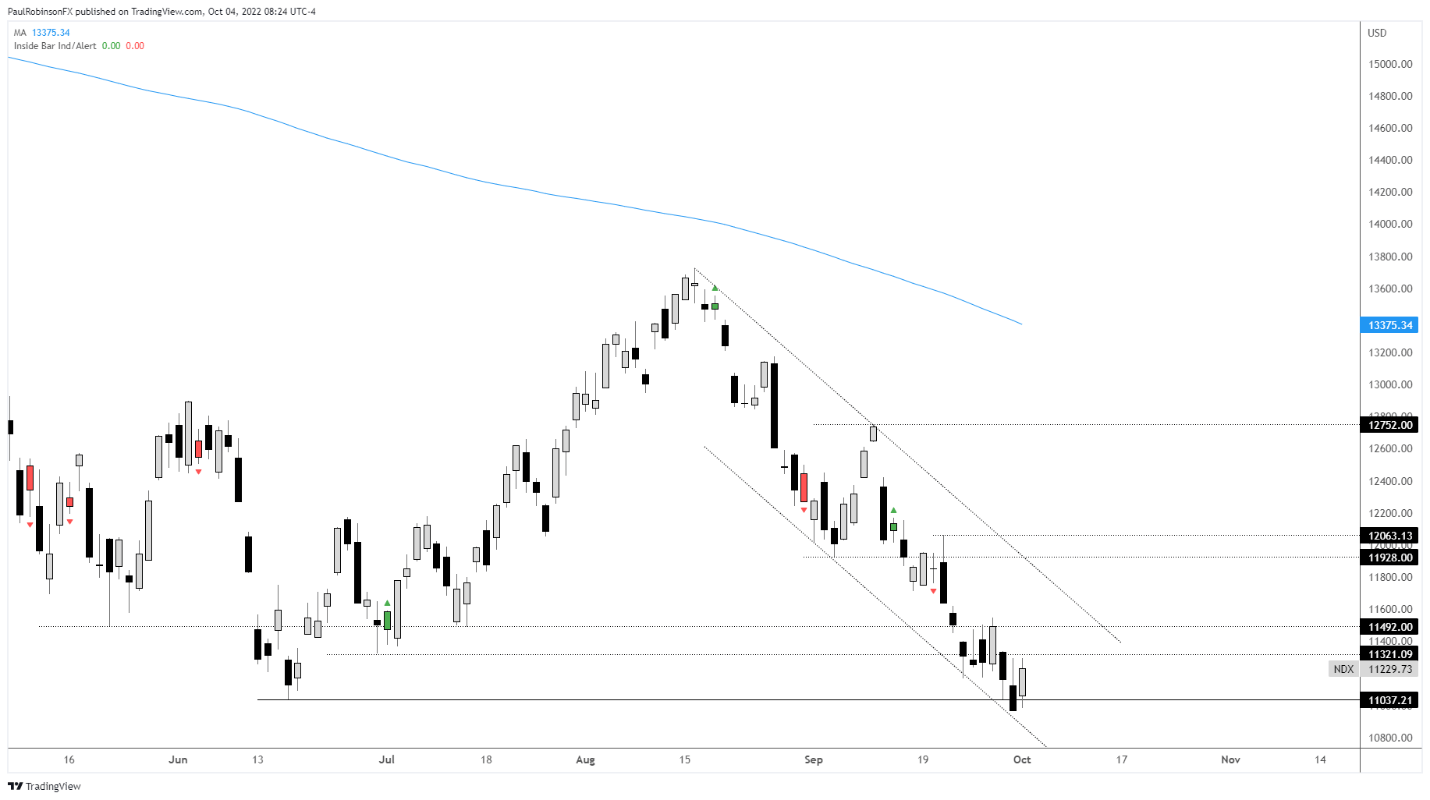
Nasdaq 100 Chart by TradingView
TheDow Jonesnot only took out the summer low but also the record high prior to the onset of the pandemic. This morning it will try to take back both of those levels, but not expected to keep them for an extended period of time. Watch 30149 in the near-term as resistance, and on the downside the recent low at 28715 as support.
Dow Jones Daily Chart
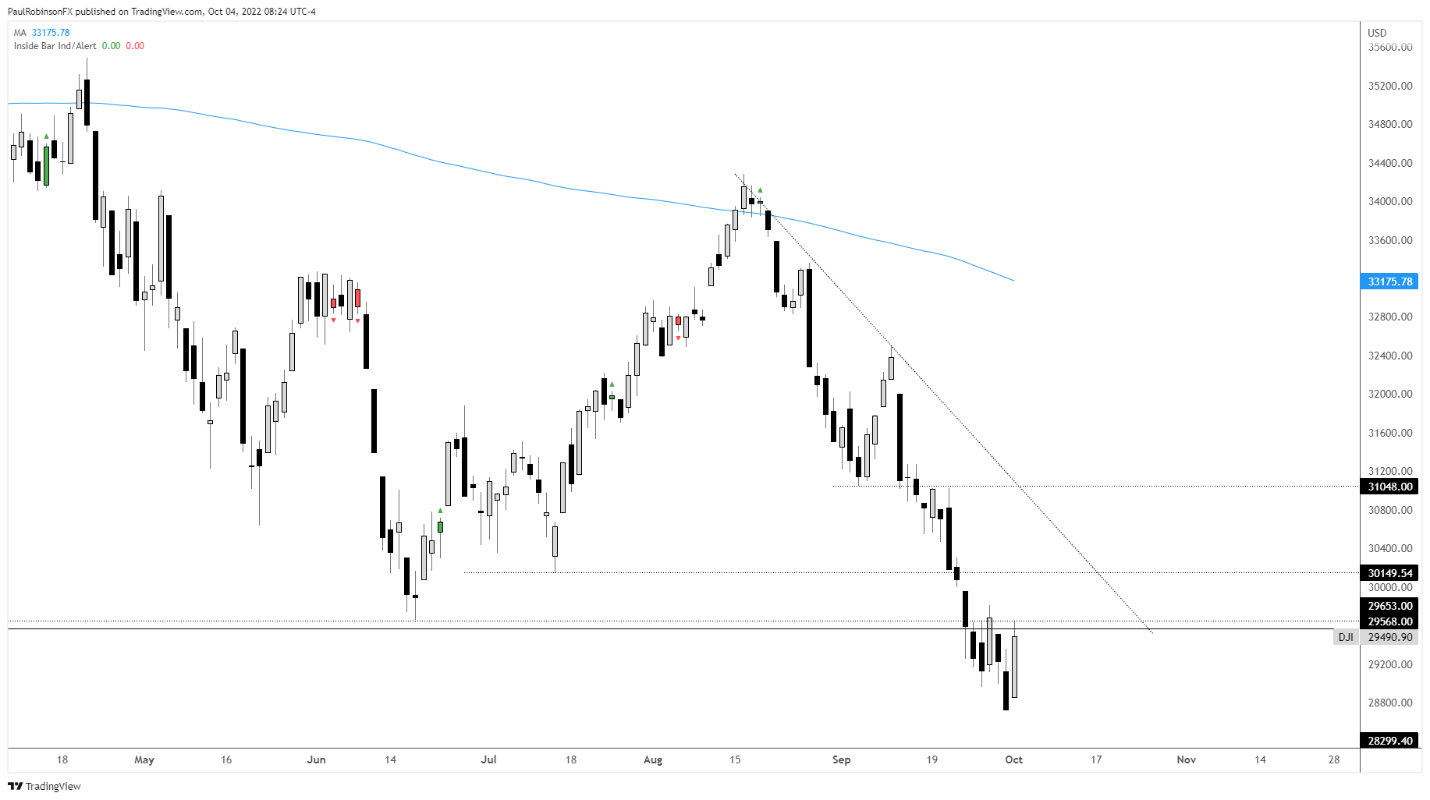
Dow Jones Chart by TradingView
Resources for Forex Traders
Whether you are a new or experienced trader, we have several resources available to helpyou;indicator for trackingtrader sentiment, quarterlytrading forecasts, analytical and educationalwebinarsheld daily,trading guidesto help you improve trading performance, and one specifically for those who arenew to forex.
---Written by Paul Robinson, Market Analyst
You can follow Paul on Twitter at @PaulRobinsonFX


