


U.S. Indices Technical Outlook:
- S&P 500 may bounce around the June lows, but lower levels and fear still needed
- We are getting there, a low in October looking increasingly likely
- S&P 500, Nasdaq 100, Dow Jones technicals/charts

S&P 500, Dow Jones, Nasdaq 100 Outlook: Bounce May Unfold, but Short-lived
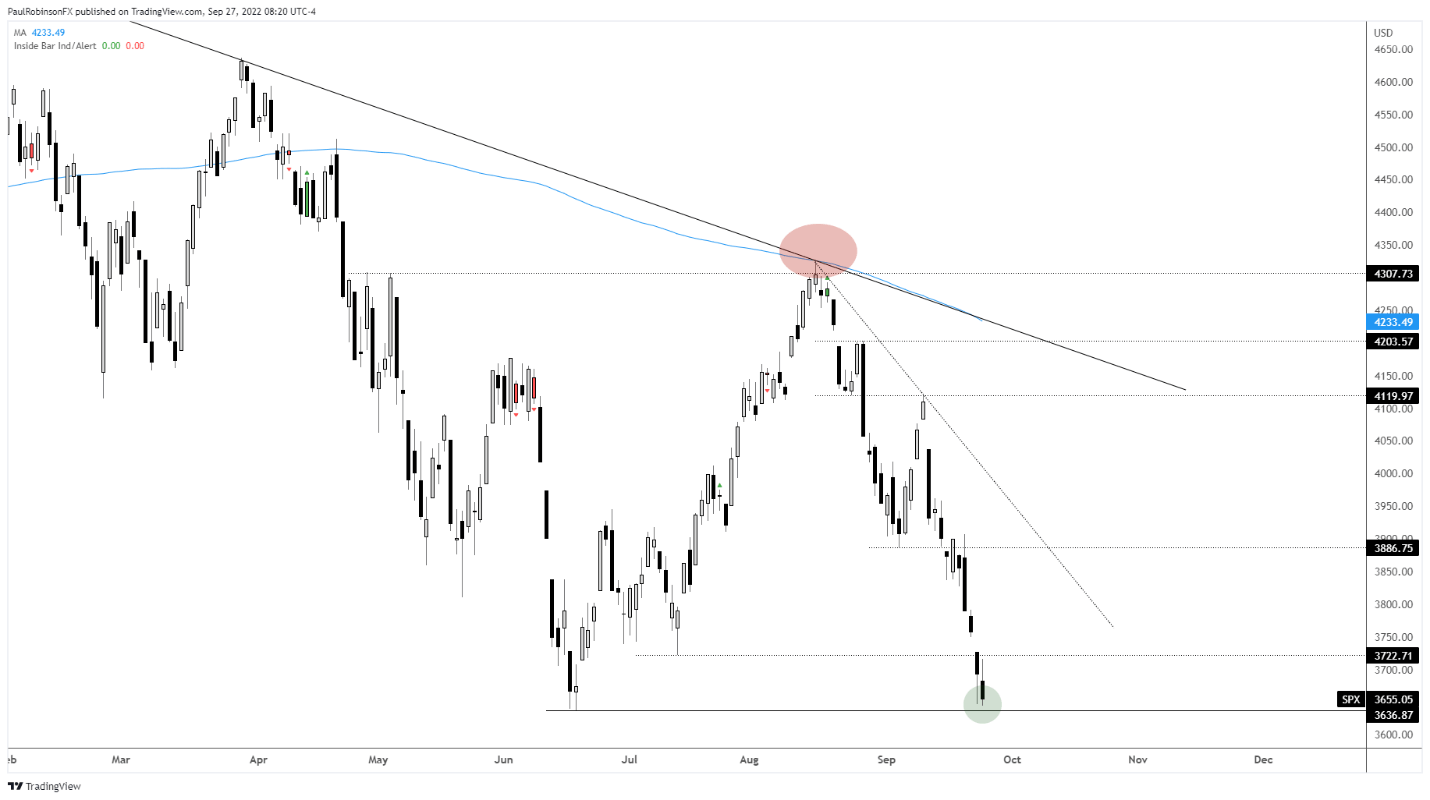
The market may bounce around the June lows, but until we see a fresh low with some capitulation (fear selling) it doesn’t appear we can put in a sustainable bottom. The S&P 500 is seeing some overnight buying as global markets bounce a bit, but the bounce appears likely to be short-lived, up to perhaps the mid-3700s.
When you look at bear market price action it is quite common to see a bounce come right around a previous low, sometimes after breaking it first. And some of these rallies can be fierce, making it seem like a low is in, but until we see a material lower-low and some fear set in, it seems unlikely we will sustain a rally for long.
The VIX index is starting to perk up a bit, an indicator I like to watch during these times. Most of the time the indicator doesn’t provide a lot of useful information, but when markets go into liquidation mode and the VIX spikes it is a very good indicator at telling you were are “getting there”. And this behavior in selling is usually what it takes to get some type of market low in.
Yesterday the VIX go up near 33, but is looking like on this trip it will need to get to 40 or higher, and in sharp fashion before we get near a low in stocks.
It does appear we may not be far off from this happening, and would fit nicely with the idea of the market posting a seasonal low in October. But the thinking is we won’t see that happen until the S&P reaches 3500/3400 are first.

S&P 500 Daily Chart
The Nasdaq 100 needs to clear 11037 before it can post a new low, something that is anticipated to happen here very soon. A bounce may lead the index up towards the 11500/700 zone, with the downward channel line from August as the very upper threshold.
Nasdaq 100 Daily Chart
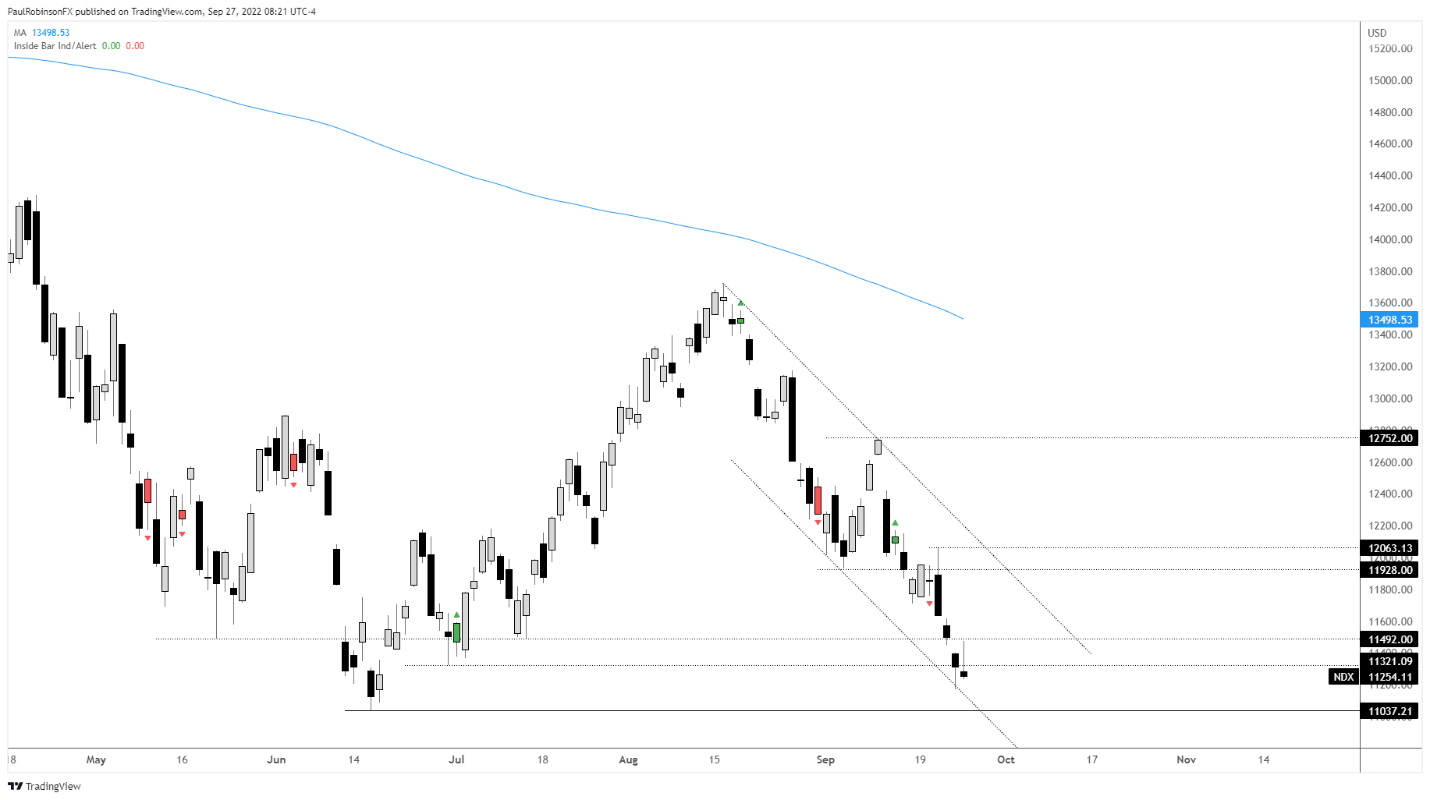
Nasdaq 100 Chart by TradingView
TheDow Jonesis in an interesting spot because it is has already made a new cycle low, and also closed below the 2020 high that proceeded the onset of covid. The area around 29560/750 is viewed as resistance now. And while it will be first respected as such, if we do get a sharp market squeeze higher it could still reclaim old support but not find much meaning in doing so. The new low in the SPX and NDX are still anticipated to happen here soon. One spot I’ m watching on the downside is the massive November 6 2020 US election gap, it resides at 28323. It looks poised to finally get filled.
Dow Jones Daily Chart
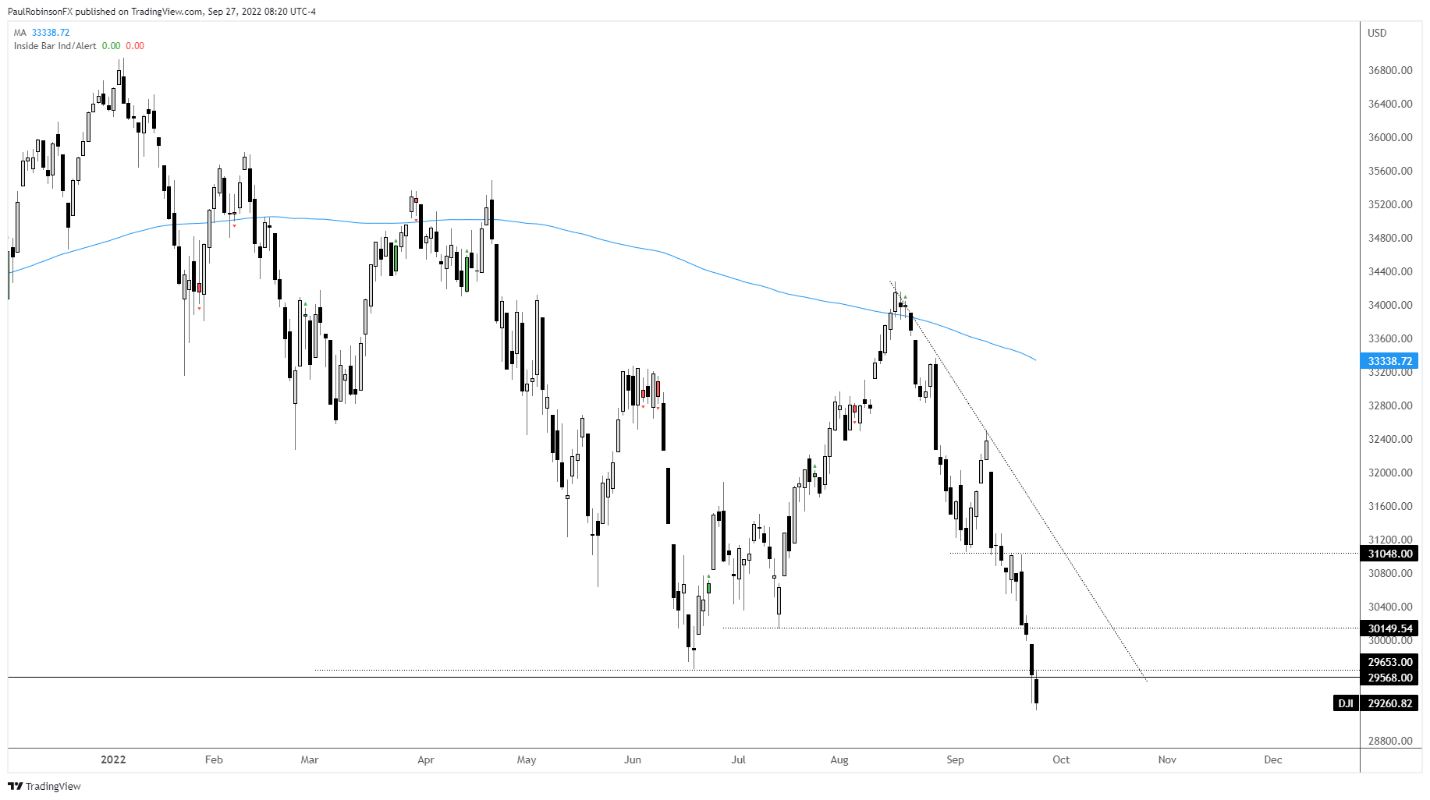
Dow Jones Chart by TradingView
Resources for Forex Traders
Whether you are a new or experienced trader, we have several resources available to helpyou;indicator for trackingtrader sentiment, quarterlytrading forecasts, analytical and educationalwebinarsheld daily,trading guidesto help you improve trading performance, and one specifically for those who arenew to forex.
---Written by Paul Robinson, Market Analyst
You can follow Paul on Twitter at @PaulRobinsonFX


