


S&P 500, SPX, NASDAQ 100, NDX - OUTLOOK:
- The S&P 500 and the Nasdaq 100 index have staged bullish breakouts last week.
- US equities have scope to rise further.
- What are the key levels to watch?

The S&P 500 and the Nasdaq 100 index appear to be flexing muscles on easing US Treasury yields amid growing hopes of an earlier-than-expected pause in the Fed hiking cycle.
Despite the turmoil in the banking sector, stocks have gained in the first three months of the year on signs of easing inflation. Both indices maintain a bullish posture going into a holiday-shortened, but data-heavy week, starting with the US ISM manufacturing data today, job openings on Tuesday, ISM services and ADP private payrolls report on Wednesday and the monthly jobs report on Friday.
Another key focus will be energy prices following a surprise announcement of production cuts from major oil producers.A strong rise in energy prices could dent some of the optimism related to an early end to the Fed tightening cycle, posing a risk to equities.
Nasdaq 100 Daily Chart
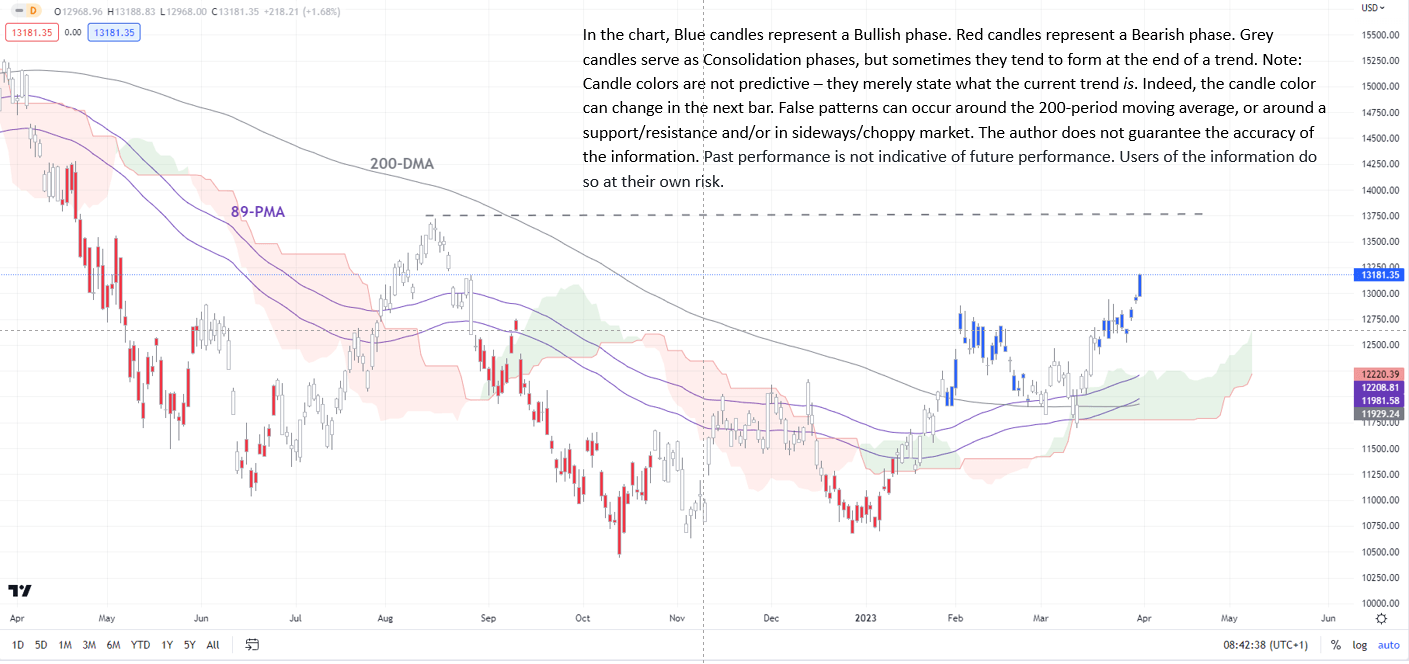
Chart Created by Manish Jaradi Using Tradingview
On technical charts, the S&P 500 and the Nasdaq 100 remain in their respective bullish phases,first highlighted in February(see colour-coded charts). Both indices last week rose above key resistance levels, pointing to further gains ahead of the upcoming US quarterly earnings season.
S&P 500 Daily Chart
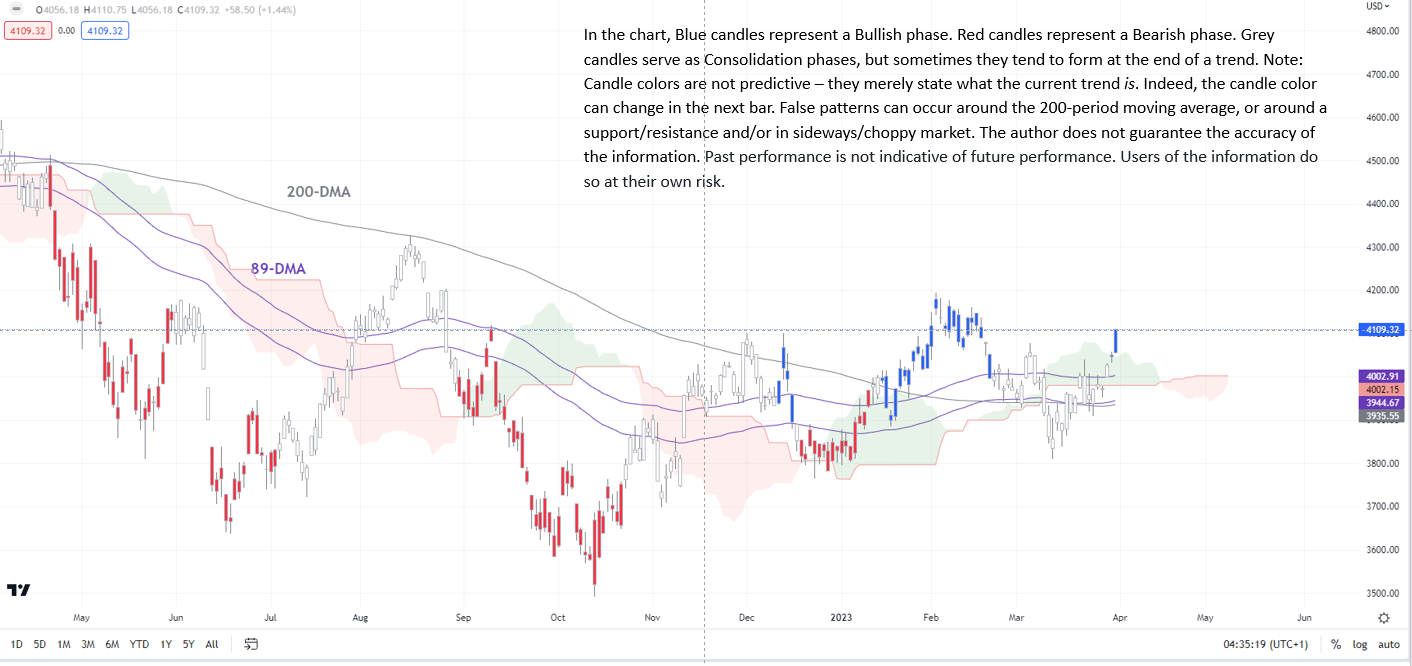
Chart Created by Manish Jaradi Using Tradingview
S&P 500: Uptrend remains intact
The S&P 500 index’s break last week above the immediate ceiling at the early-March high of 4078 has raised the odds of a move toward the August high of 4325. In this regard, a break above the interim resistance at the February high of 4195 would seal the move. Moreover, in a sign of bullishness, on the monthly charts, the index in March closed above the past four months' range.
S&P 500 Daily Chart
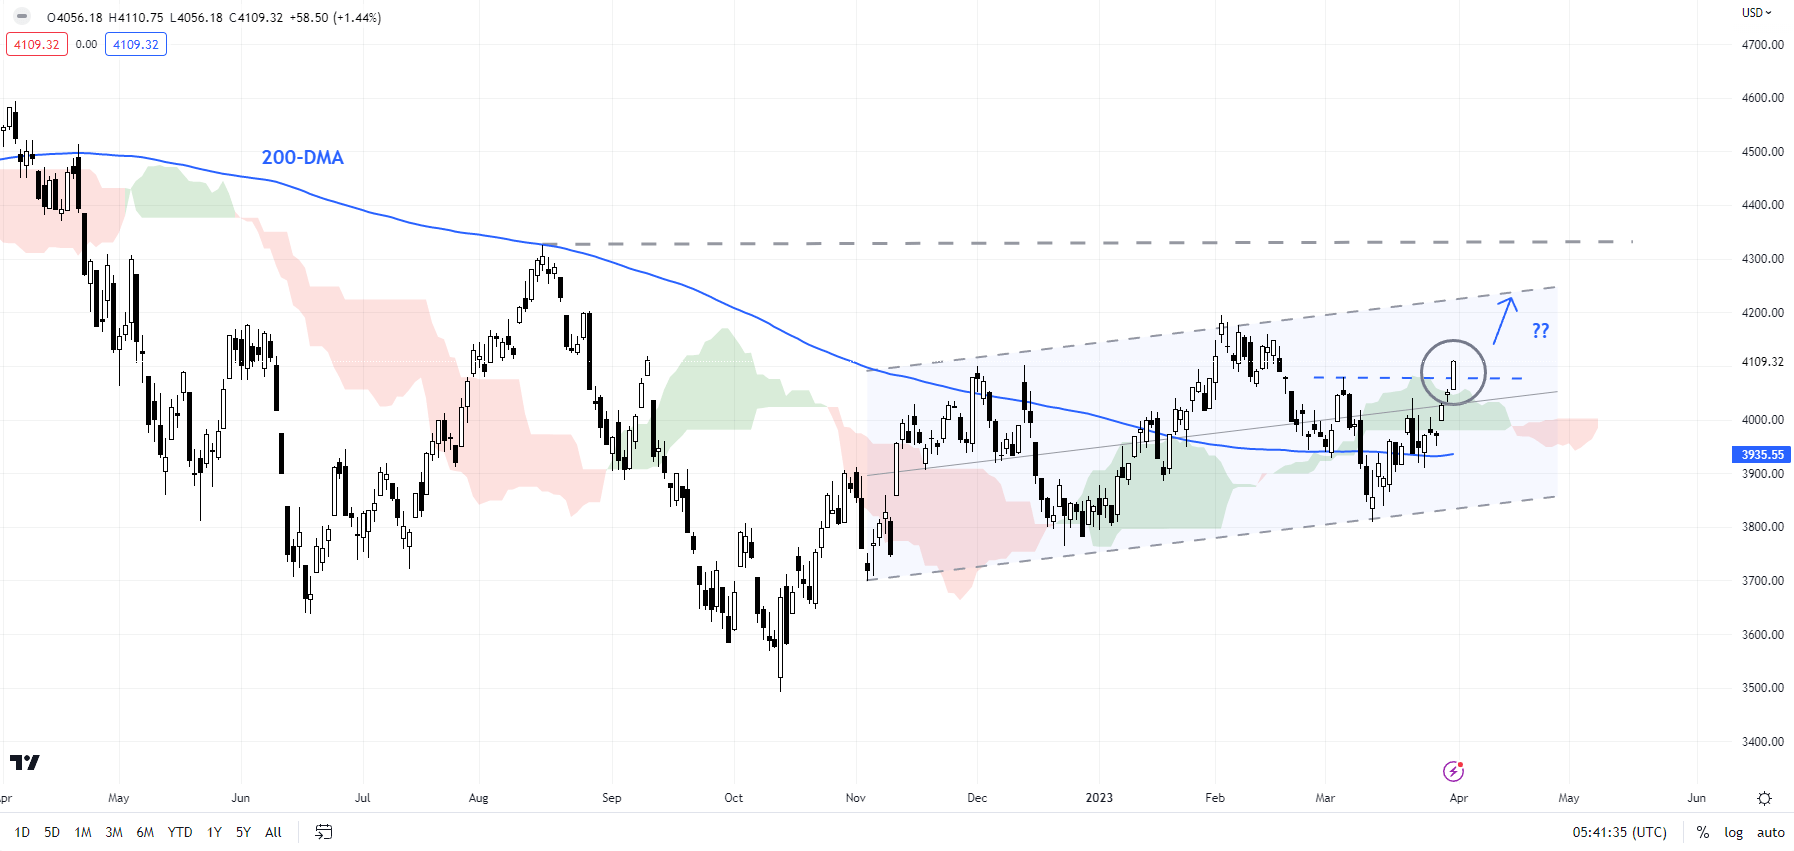
Chart Created Using Tradingview
The rise in recent days follows a rebound from quite a strong cushion at the December low of 3765, reaffirming the higher-top-higher-bottom sequence since October 2022.As highlighted in the previous update, only a break below 3765 would confirm that the nascent uptrend had been truncated.
NASDAQ 100 Daily Chart
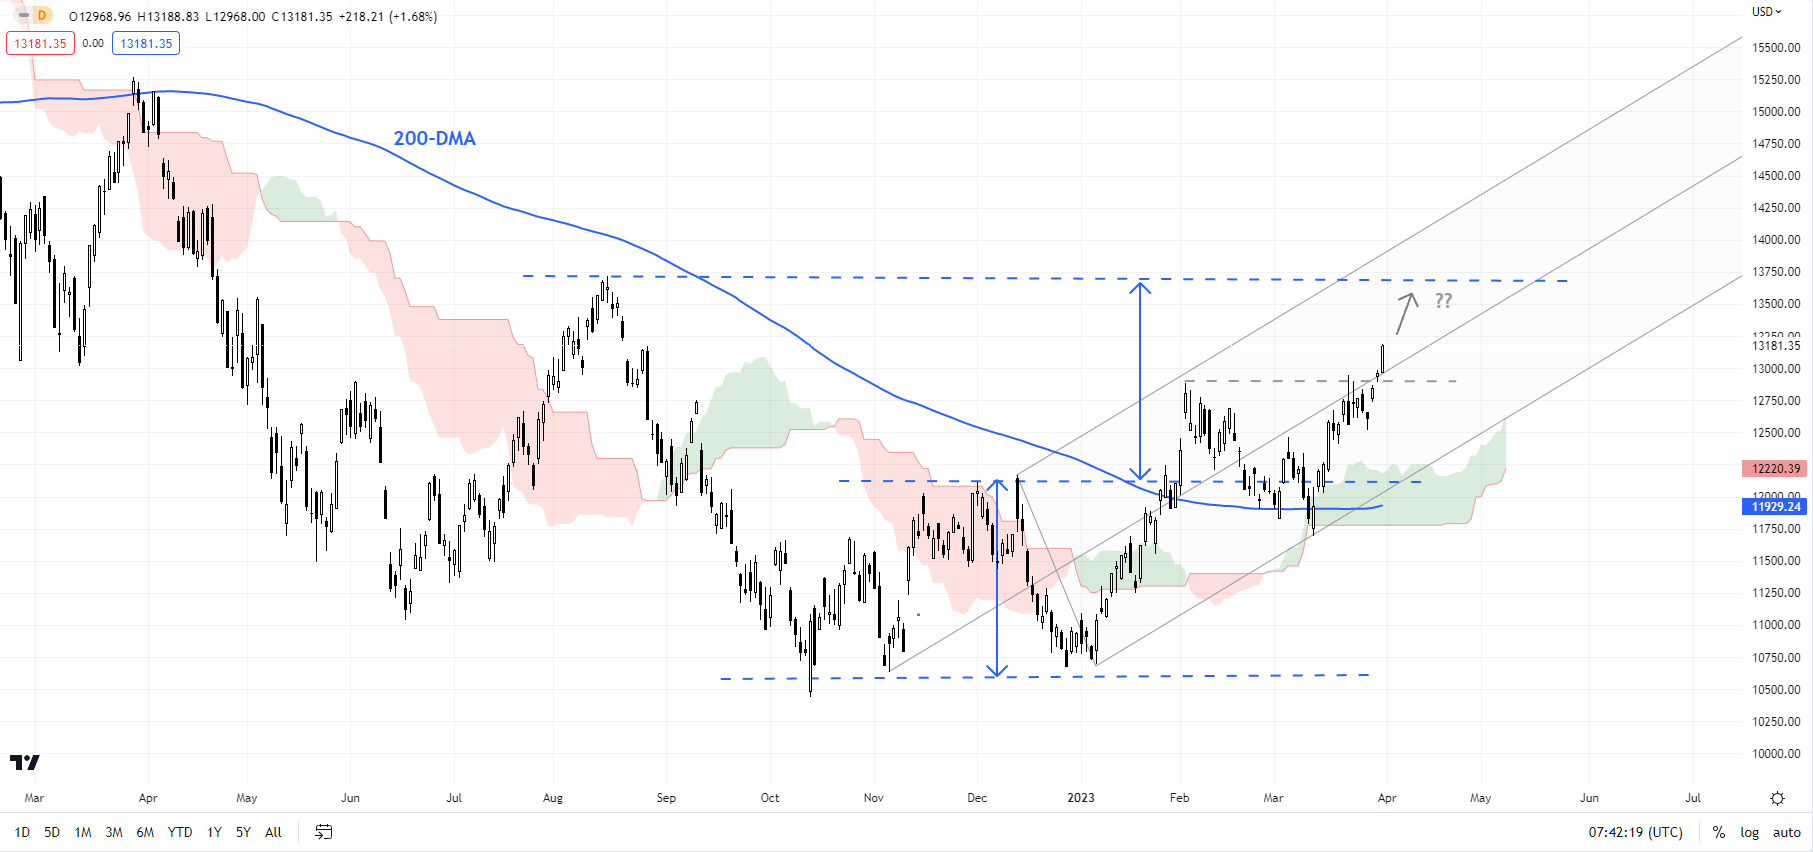
Chart Created Using Tradingview
Nasdaq 100: Looks set to retest the August high
The Nasdaq 100 index’s break above the February high of 12880 has more or less sealed the case for a rise toward the August high of 13720. Importantly, last week’s jump solidifies the higher-top-higher-bottom sequence since the end of 2022, raising the odds that the worst could be over for technology stocks.
Immediate support is at last week’s low of 12518. Stronger support is at the March low of 11695 – the index needs to hold above the support for the uptrend to remain intact.
Trade Smarter - Sign up for the DailyFX Newsletter
Receive timely and compelling market commentary from the DailyFX team
--- Written by Manish Jaradi, Strategist for DailyFX.com
--- Contact and follow Jaradi on Twitter: @JaradiManish


