


S&P 500, SPX, NASDAQ 100, NDX - OUTLOOK:
- The S&P 500 and the Nasdaq 100 index seem to have settled in a bullish consolidation pattern.
- US equities have scope to rise further.
- What are the key levels to watch?

Barring any immediate spike in volatility after the US inflation data release US equities appear to be gearing up for another leg higher.
The S&P 500 and the Nasdaq 100 index seem to have settled recently in a bullish flag pattern – a continuation pattern. Any break above the upper edge of the flags could clear the way toward the respective August highs (see the previous update for more details). Moreover, trend/momentum indicators suggest US equities have recently entered a bullish phase for the first time since the downtrend began (see the colored charts).
S&P 500 Daily Chart
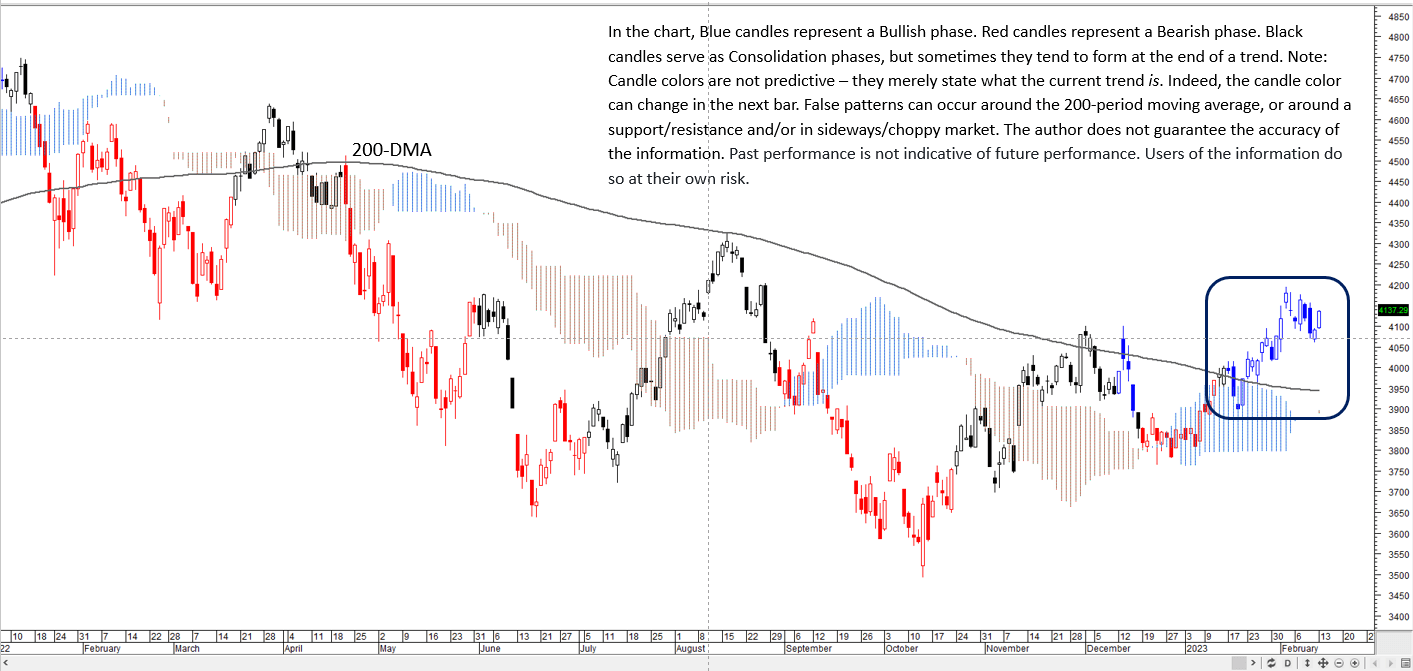
Chart Created by Manish Jaradi Using Metastock
Furthermore, despite the strong US jobs and services data, the S&P 500 and the Nasdaq 100 index managed to hold above their respective resistance-turned-support at the end-2022 highs. The data, however, prevented the indices from advancing further following their respective bullish breakouts last month (see the end-January update).
NASDAQ 100 Daily Chart
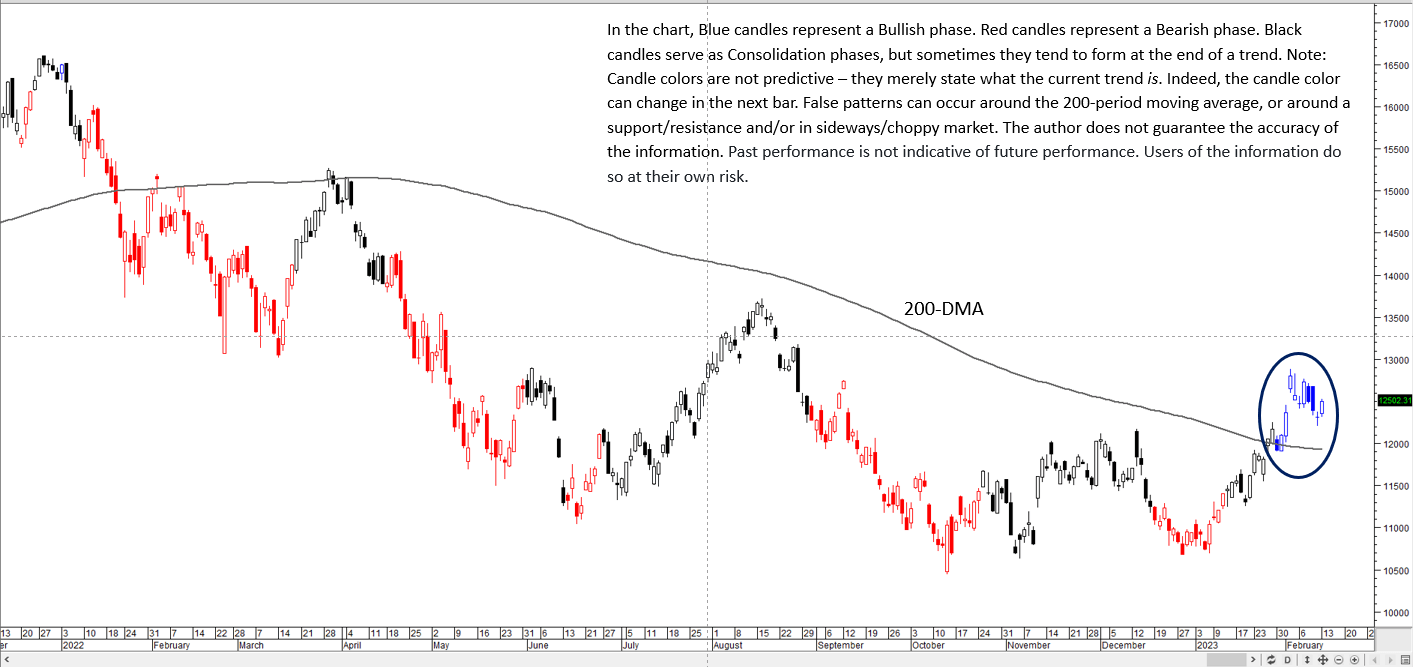
Chart Created by Manish Jaradi Using Metastock
The humped S&P 500 implied volatility term structure reflects the anxiety ahead of the US CPI data due later today given the recent repricing higher in Fed terminal rate expectations. US monthly consumer prices and core CPI likely rose 0.4% on-month in January. Core CPI likely rose 5.5% on-year and the headline inflation rose 6.2% on-year last month.
S&P 500 Daily Chart
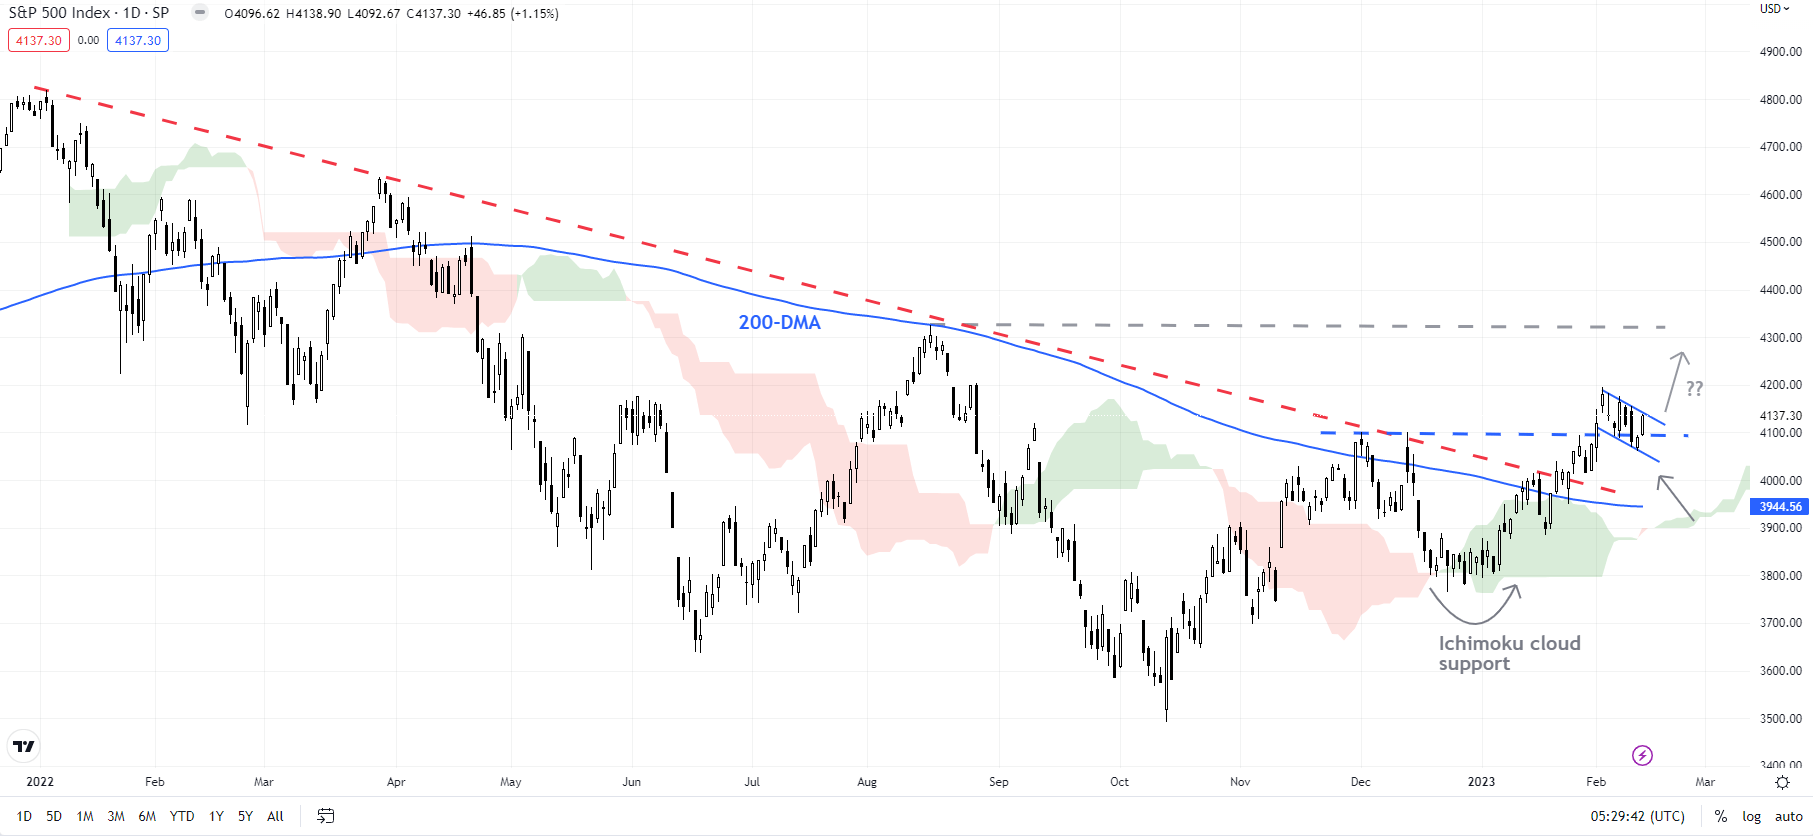
Chart Created Using TradingView
A softer-than-expected data could reaffirm the view that US inflation is peaking and soothe investors’ nerves, especially since Fed Chair Powell didn’t lean toward an aggressive stance in a speech after the jobs data release.
NASDAQ 100 Daily Chart
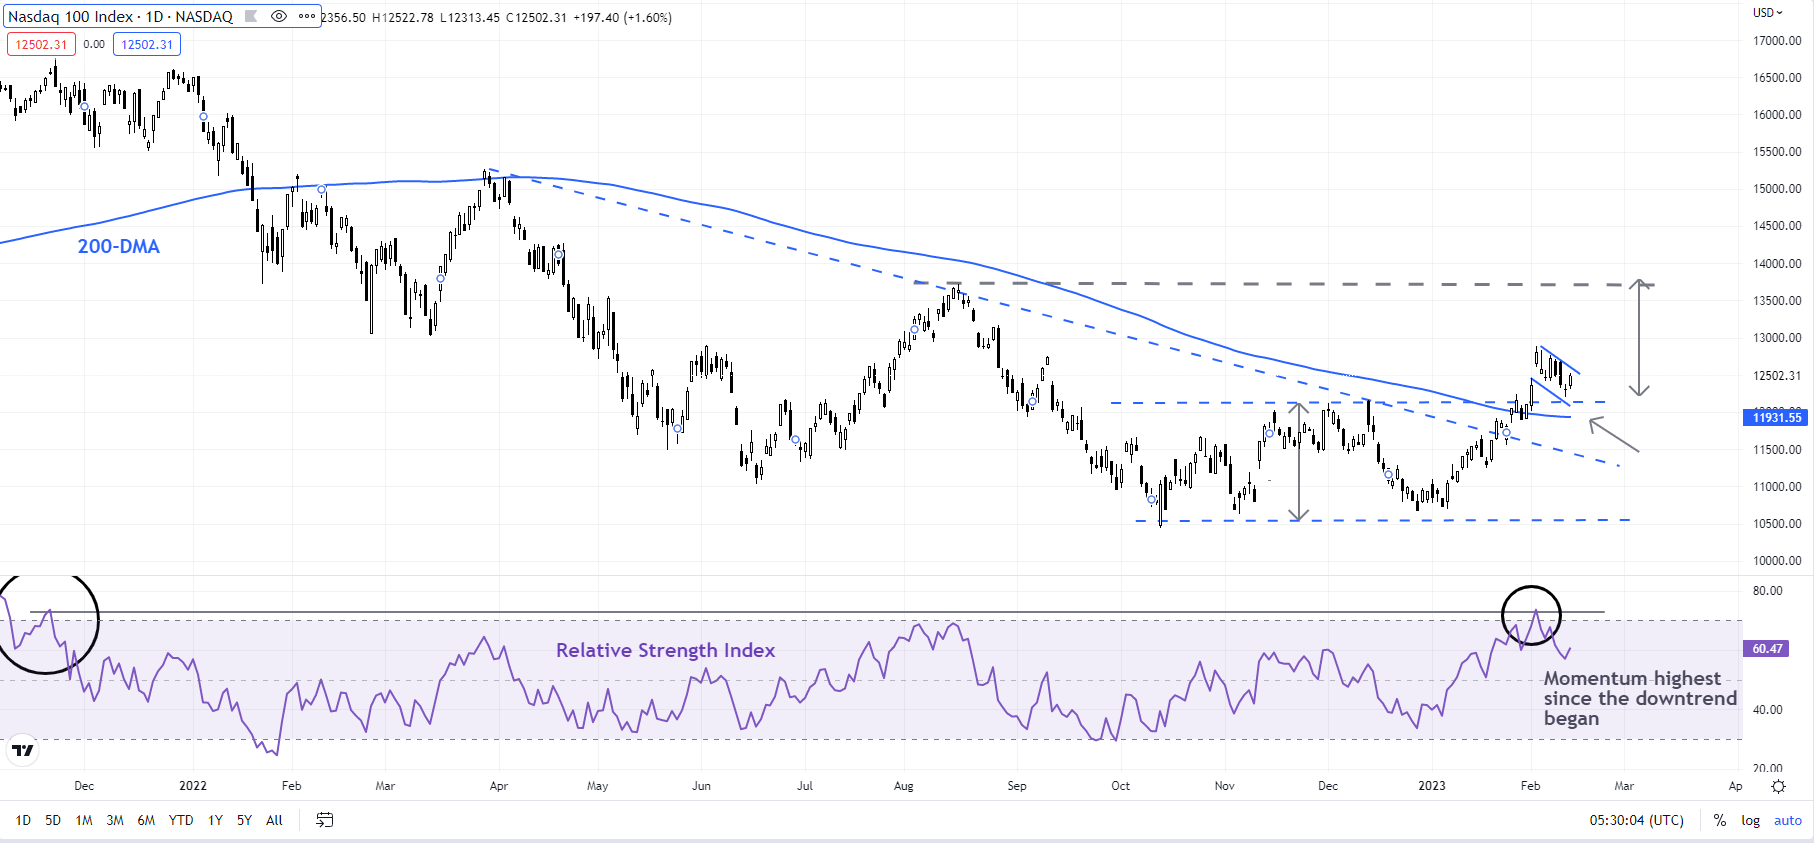
Chart Created Using TradingView
The risk, of course, is a sharp retreat in the indices below vital cushion at their respective end-2022 highs. Such a break would raise the odds that the short-term upward pressure was easing. Only a break below the December low of 3765 in the S&P 500 index and 10672 for the Nasdaq 100 would pose a risk to the nascent uptrend, raising the chances of a deeper setback.
Trade Smarter - Sign up for the DailyFX Newsletter
Receive timely and compelling market commentary from the DailyFX team
--- Written by Manish Jaradi, Strategist for DailyFX.com


