S&P 500, SPX, NASDAQ 100, NDX - TECHNICAL OUTLOOK:
- The S&P 500 index and the Nasdaq 100 index have broken above key resistance.
- The indices appear to be headed toward their respective August highs.
- How is the broader outlook evolving?

While the key central banks’ interest rate decision may have been in line with expectations, it has left US equities in a bullish state.
As widely expected, the US Federal Reserve hiked interest rates by 25 basis points, the Bank of England and the European Central Bank by 50 basis points each. The Fed was perceived to be dovish, the Bank of England’s message was dovish, and the ECB was largely viewed as hawkish.Optimism that global central banks could be pivoting coupled with better-than-expected earnings has boosted equities’ sentiment. Of the 230 companies in the S&P 500 that have reported earnings to date for Q4-22, 70% reported above analyst expectations.
S&P 500 INDEX TECHNICAL OUTLOOK – BULLISH
The S&P 500 index has decisively broken above a vital barrier at the early-December high of 4100. This follows a convincing rise above the 200-day moving average for the first time since the downtrend began last year.
S&P 500 Daily Chart
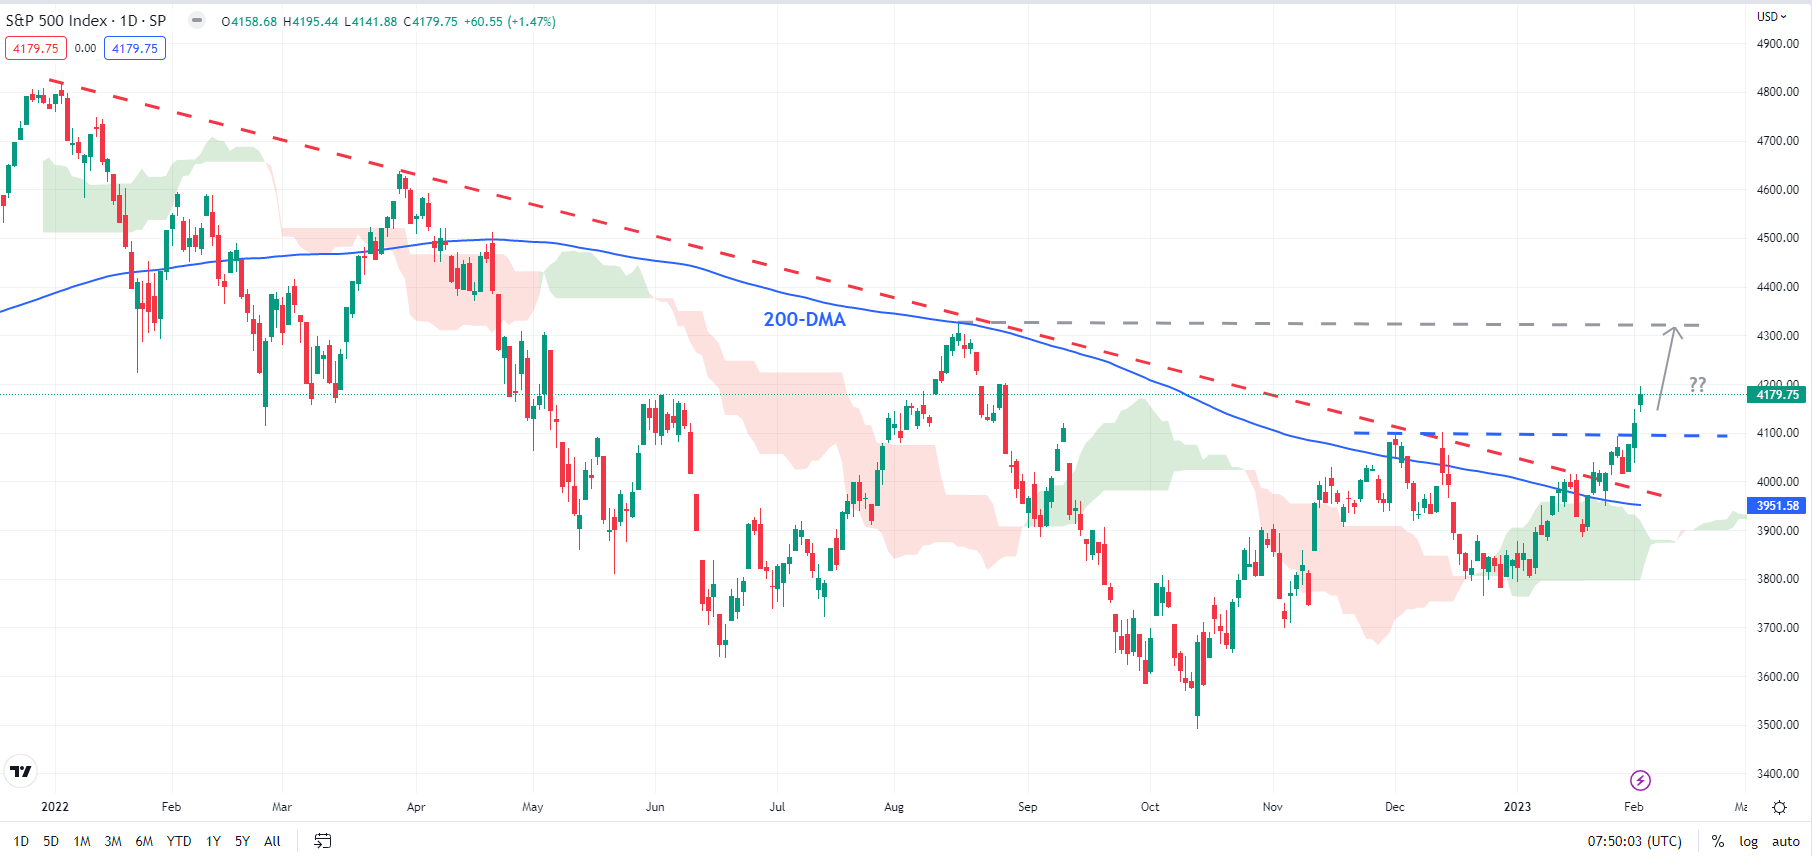
Chart Created Using TradingView
The outlook has been tentatively improving after it failed to decisively break below strong support at the June low of 3637, coinciding with the 200-week moving average. The subsequent hold above the Ichimoku cloud on the daily chart confirmed that a higher-top-higher-bottom formation was beginning to unfold. The pattern got confirmed following the jump earlier in the week.
S&P 500 Weekly Chart

Chart Created Using TradingView
The short-term outlook continues to stay bullish,in line with the previous week. Moreover, this week’s bullish move has opened the way toward the August high of 4325. For the medium-term outlook to turn constructive, the index would need to clear 4325. Such a break would open the door toward the 2022 record high of 4819.
NASDAQ 100 Daily Chart
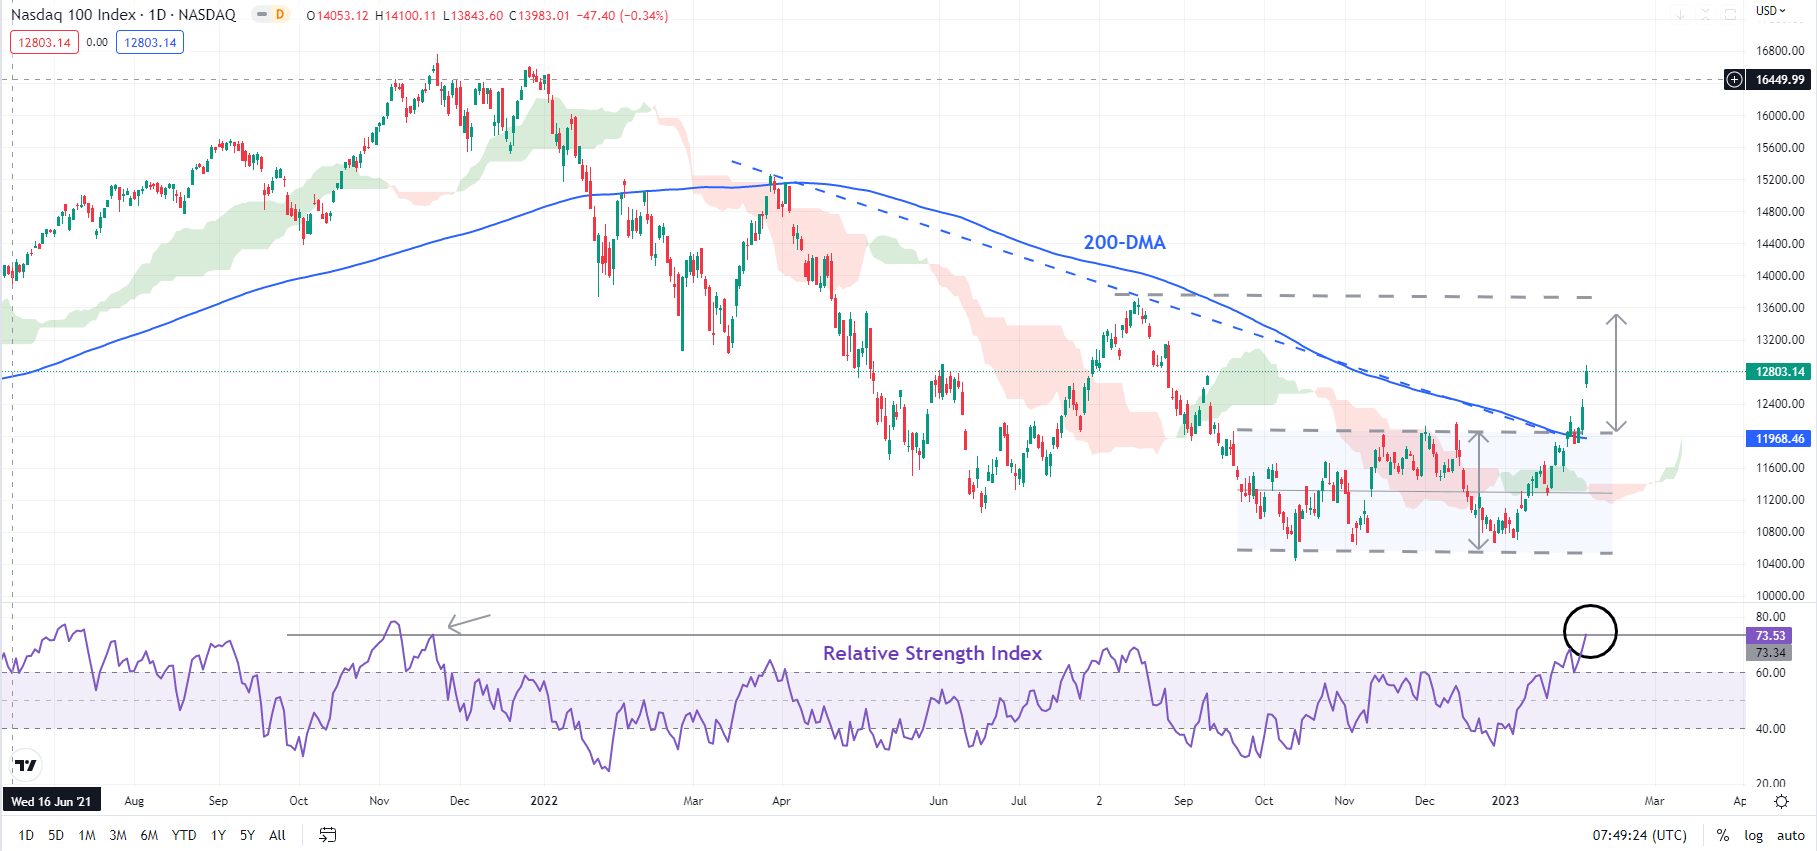
Chart Created Using TradingView
NASDAQ 100 INDEX TECHNICAL OUTLOOK – BULLISH
The Nasdaq 100 index’s decisive break above a crucial ceiling, including the December high of 12166 and the 200-day moving average, has triggered a breakout from a sideway channel from the end of 2022. The break has paved the way toward the August high of 13720. The 14-day Relative Strength Index is now at the highest level since the end of 2021, reaffirming the bullish momentum.
NASDAQ 100 Weekly Chart

Chart Created Using TradingView
Importantly, the bullish move confirms the 200-week moving as a strong base – the index flirted with the average for quite a few weeks.However, like the S&P 500 index, the August high is a significant hurdle for the Nasdaq 100 index. The price pivot coincides with the upper edge of the Ichimoku cloud. A break above the converged barrier is needed for the medium-term downward pressure to fade for the technology-heavy index.
--- Written by Manish Jaradi, Strategist for DailyFX.com