


S&P 500, SPX, NASDAQ 100, NDX - OUTLOOK:
- While the retreat in recent weeks has reduced the upward pressure, it is not sufficient to conclude that the nascent uptrend in US equities is over.
- The S&P 500 and the Nasdaq 100 index remain within their well-established rising channels.
- What’s next for the two indices?
Is the US Federal Reserve Chair Jerome Powell’s testimony to Congress this week a game changer for the S&P 500 and the Nasdaq 100 index? Probably not.
From a less-subjective perspective, the retreat in both indices doesn’t suggest the uptrend since the end of 2022 has reversed (with reference to the daily chart). As the colour-coded daily candlestick charts show, the S&P 500 index and the Nasdaq 100 index are in the Consolidation phase within the context of a broader Bullish phase. The coded charts are based on trending/momentum indicators with the objective of debiasing the view. The framework has been able to separate the consolidation phases and trending phases since the downtrend began last year.
S&P 500 Daily Chart
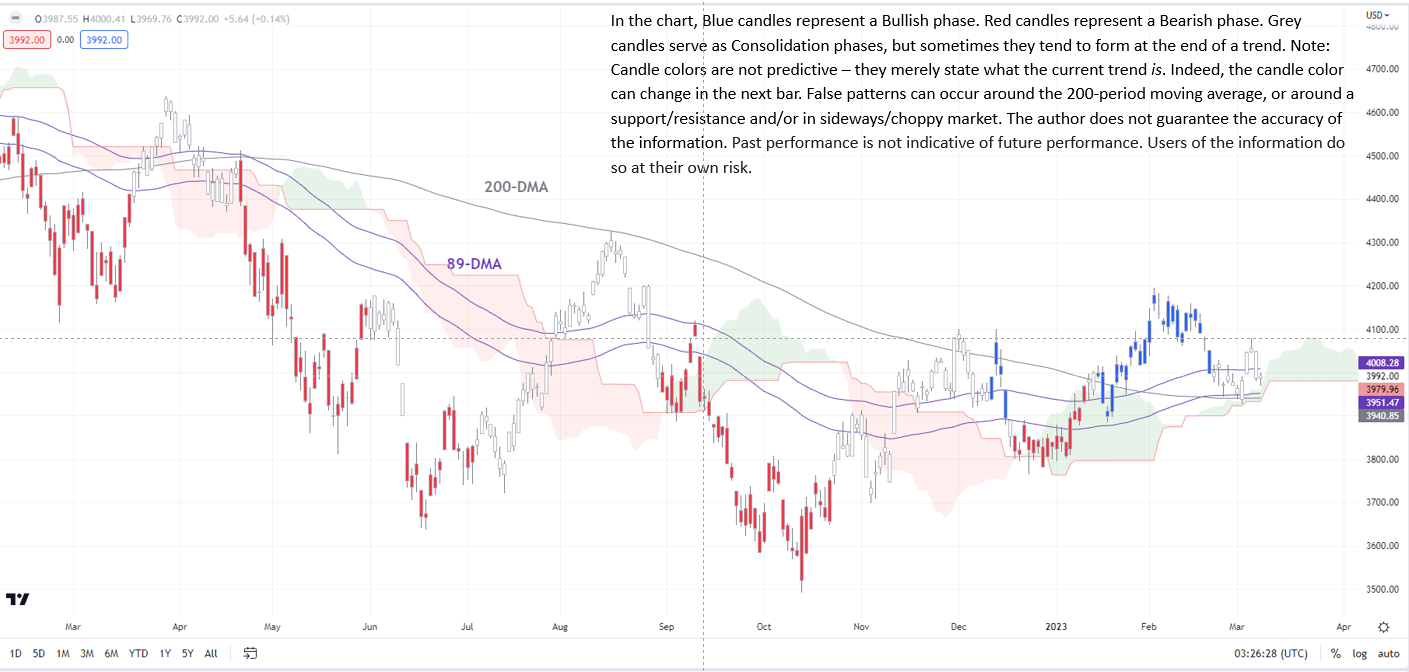
Chart Created by Manish Jaradi Using TradingView
Furthermore, with the CBOE Market Volatility index, VIX, hovering around the 2022 lows, the probability of a significant drawdown event appears to be low. The correlation with the bond market volatility index (MOVE index) seems to have broken down in recent weeks, suggesting that higher yields/a rise in bond market volatility may not be a key driver for equities, unlike last year.
Nasdaq 100 Daily Chart
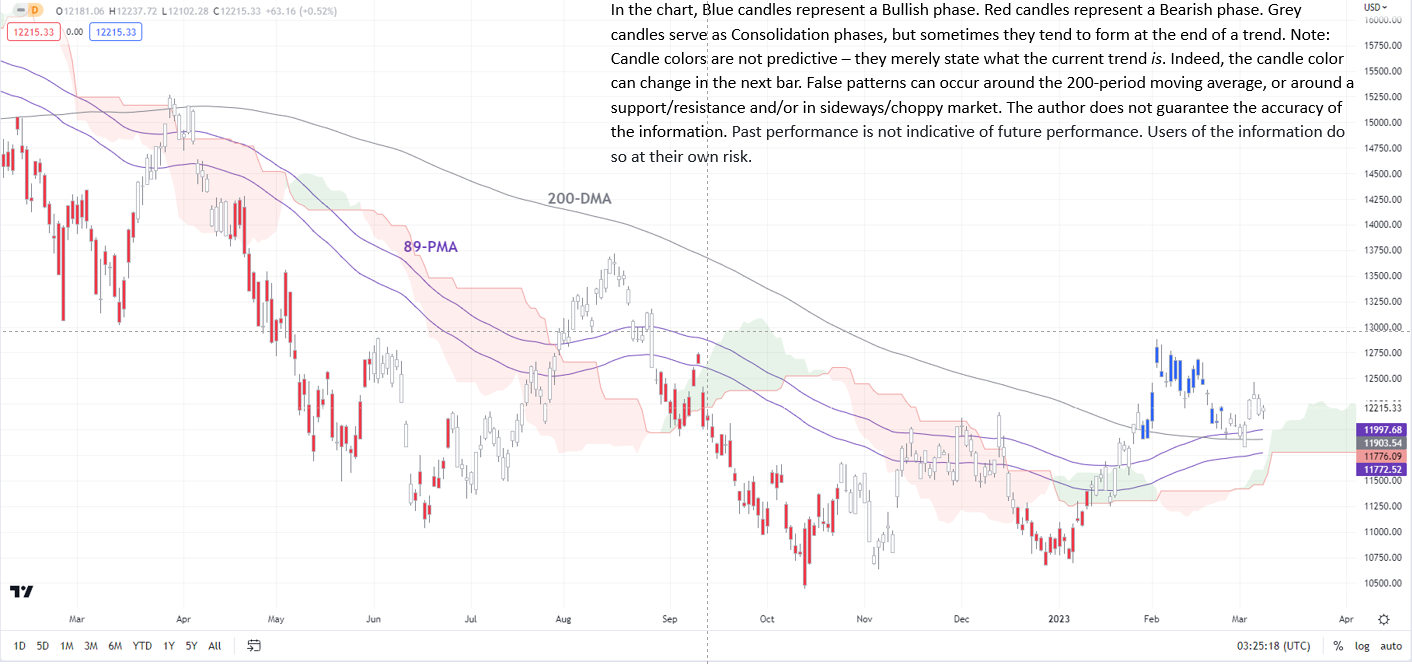
Chart Created by Manish Jaradi Using TradingView
Juxtaposing with other technical indicators the probability is high that a new (up)trend may have started since Q4-2022. Let’s look at the indices individually.
MOVE Index Vs VIX Daily Chart
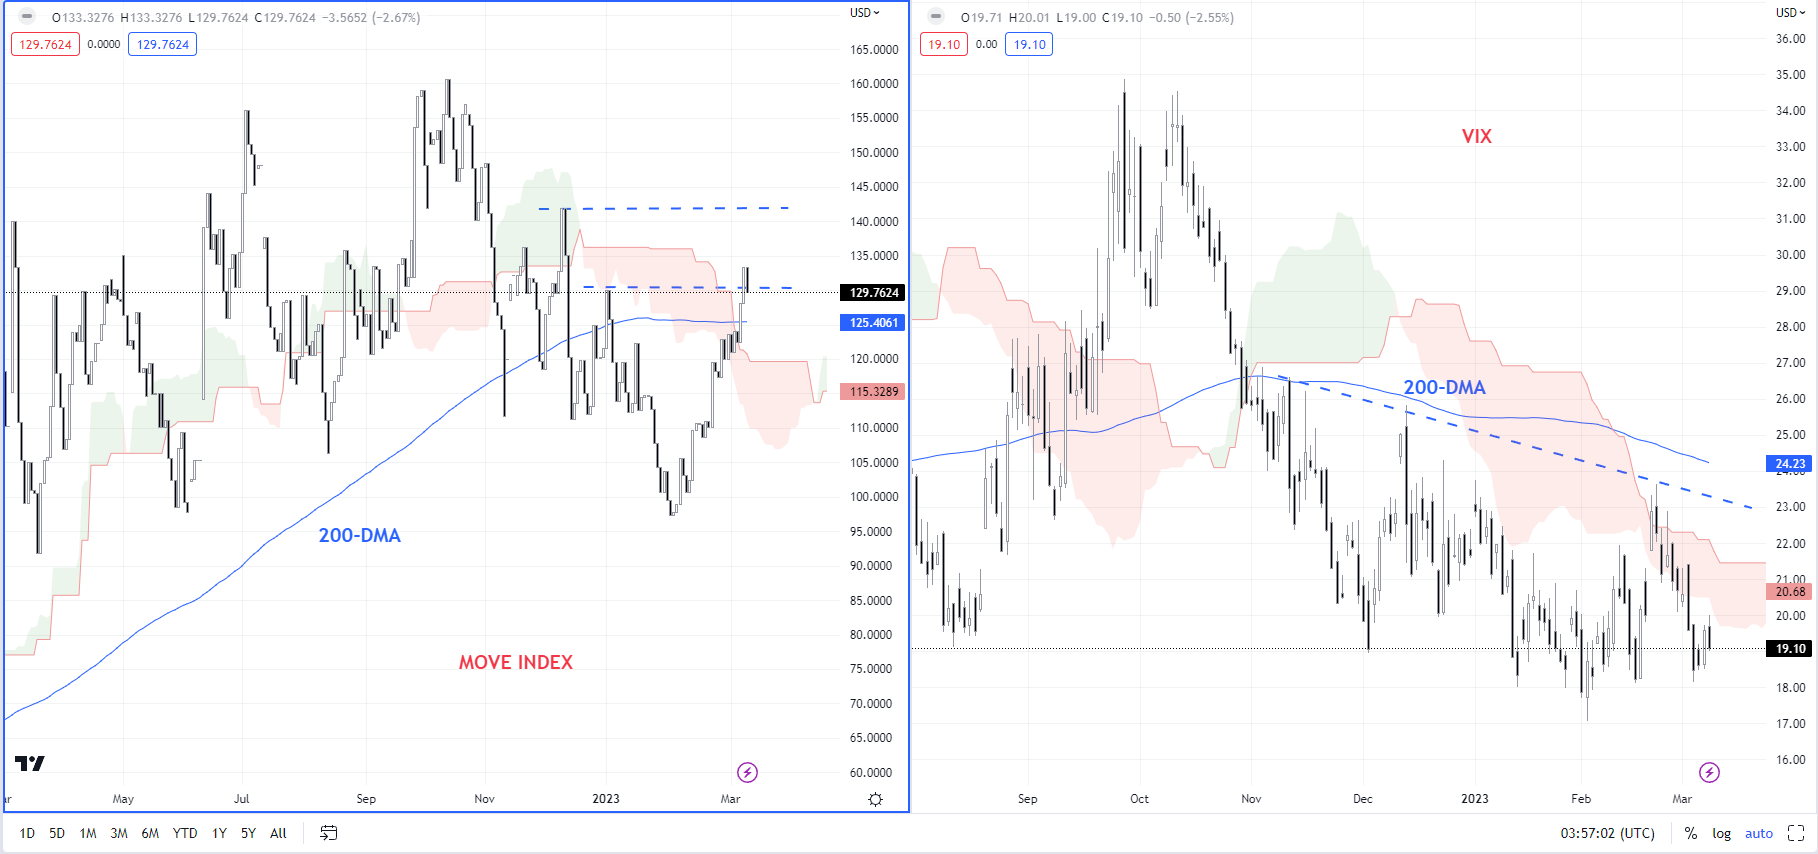
Chart Created by Manish Jaradi Using TradingView
The S&P 500 index has been cruising along a slightly upward-sloping channel since last year. Stronger-than-expected US data and increased Fed hawkishness haven’t triggered a break below the channel just yet. Furthermore, the rise above the December high of 4100 established a higher-top-higher-bottom sequence, implying an uptrend.
S&P 500 Daily Chart
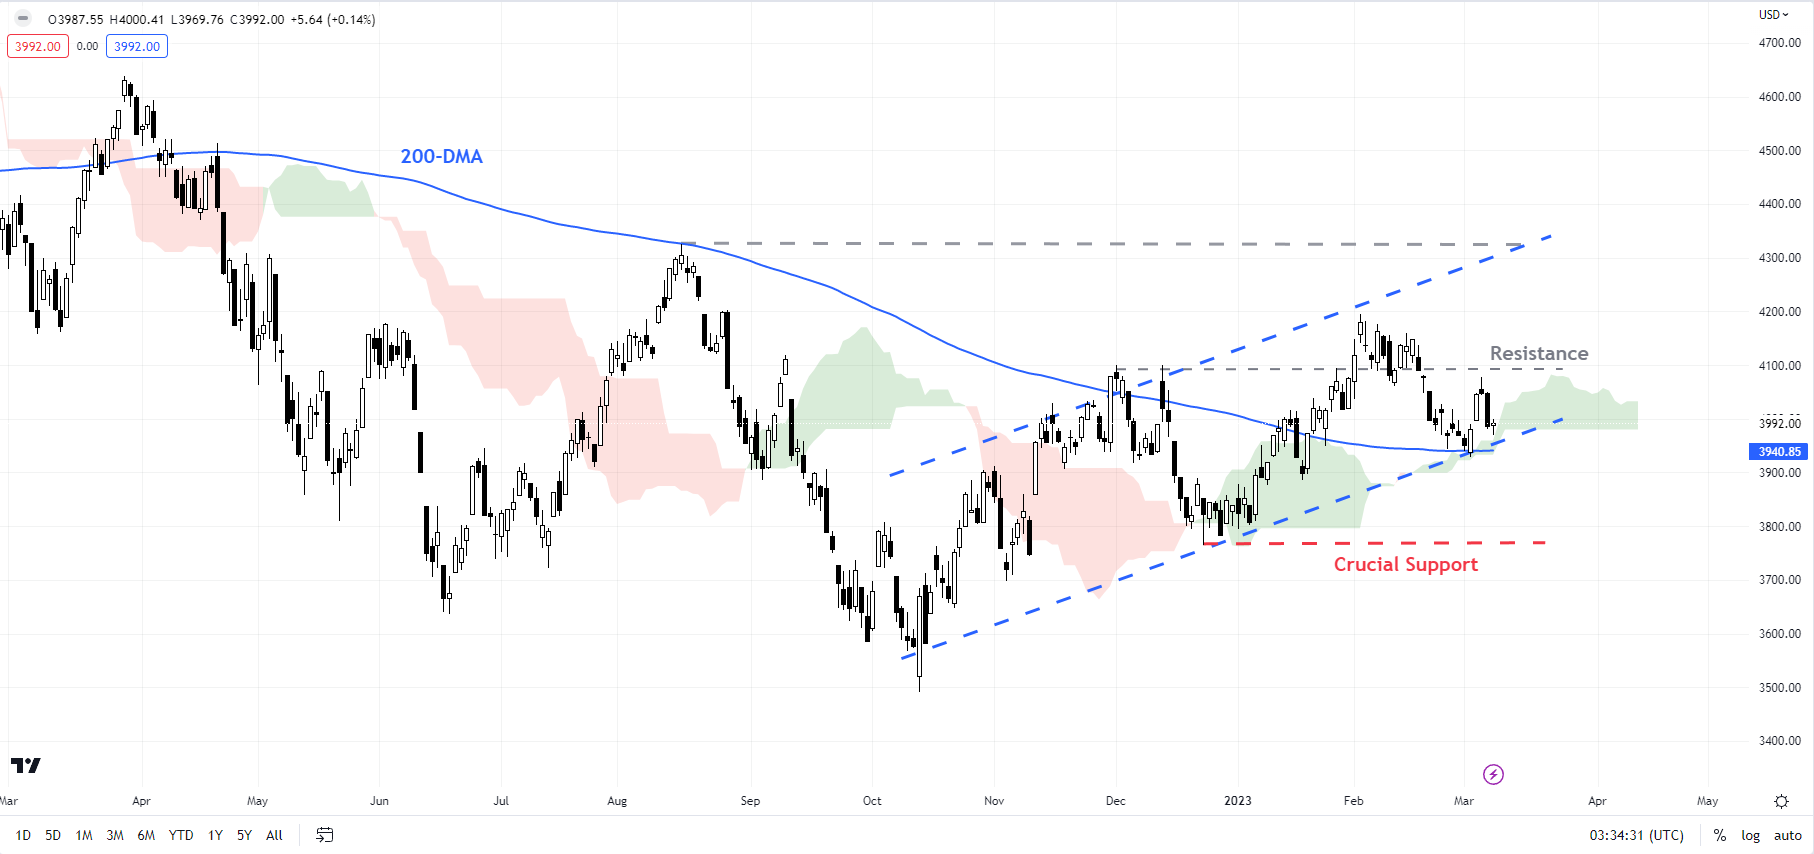
Chart Created by Manish Jaradi Using TradingView
For the four-month-long upward pressure to dissipate, the index would need to break below the vital cushion at the December low of 3765. Such a break would disrupt the higher-top-higher-bottom pattern since October, pointing to a broader 3500-4200 range in the interim.
NASDAQ 100 Daily Chart
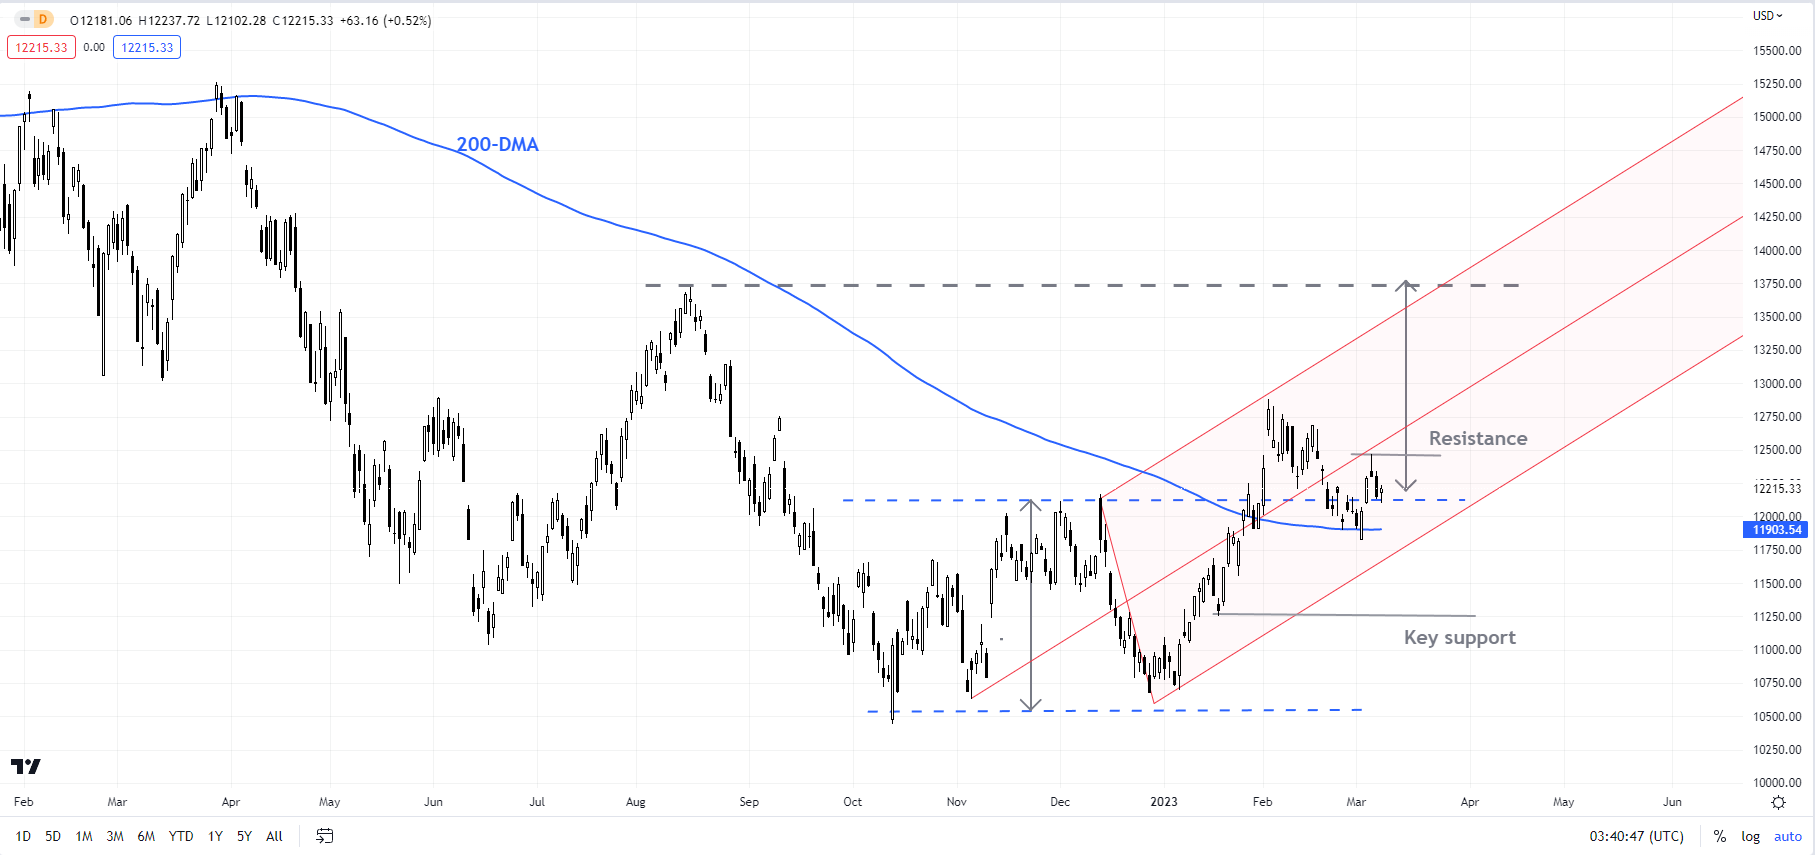
Chart Created by Manish Jaradi Using TradingView
Like the S&P 500 index, the Nasdaq 100 index remains well within a rising pitchfork channel since November. The decisive break above the December high of 12166 triggered a breakout from a sideway range potentially clearing the path toward the August high of 13721. The index would need to break below key support at the 11200-11800 area for the upward pressure to reverse.
Trade Smarter - Sign up for the DailyFX Newsletter
Receive timely and compelling market commentary from the DailyFX team
--- Written by Manish Jaradi, Strategist for DailyFX.com
--- Contact and follow Jaradi on Twitter: @JaradiManish


