


S&P 500, SPX, NASDAQ 100, NDX - OUTLOOK:
- The S&P 500 index’s uptrend remains intact despite the turmoil in the bank sector.
- In comparison, the Nasdaq 100 looks stronger as it flirts with the 2023 highs.
- What’s next for the two indices?

The S&P 500 and the Nasdaq 100 index have been resilient despite the turmoil in the banking sector. However, the indices would need a strong catalyst to break higher from the recently established ranges.
Despite the turmoil in the banking sector, the benchmark US indices haven’t broken any key support. First Citizens BancShares takeover of a part of Silicon Valley Bank, UBS’ move to acquire Credit Suisse, and the willingness of regulators to provide liquidity/backstop facilities have provided comfort to investors that the worst banking shock since the Great Financial Crisis would be contained.
Moreover, no fresh ‘bad’ news in recent days regarding contagion to other regional/global financial sectors is perceived as ‘good’ news. Having said that, the overall tightening in credit conditions (including Fed rate hikes) raises the odds of a US recession, while the prospect of stricter regulations for banks means that the sector could continue to face headwinds in the near term.
Nasdaq 100 Daily Chart
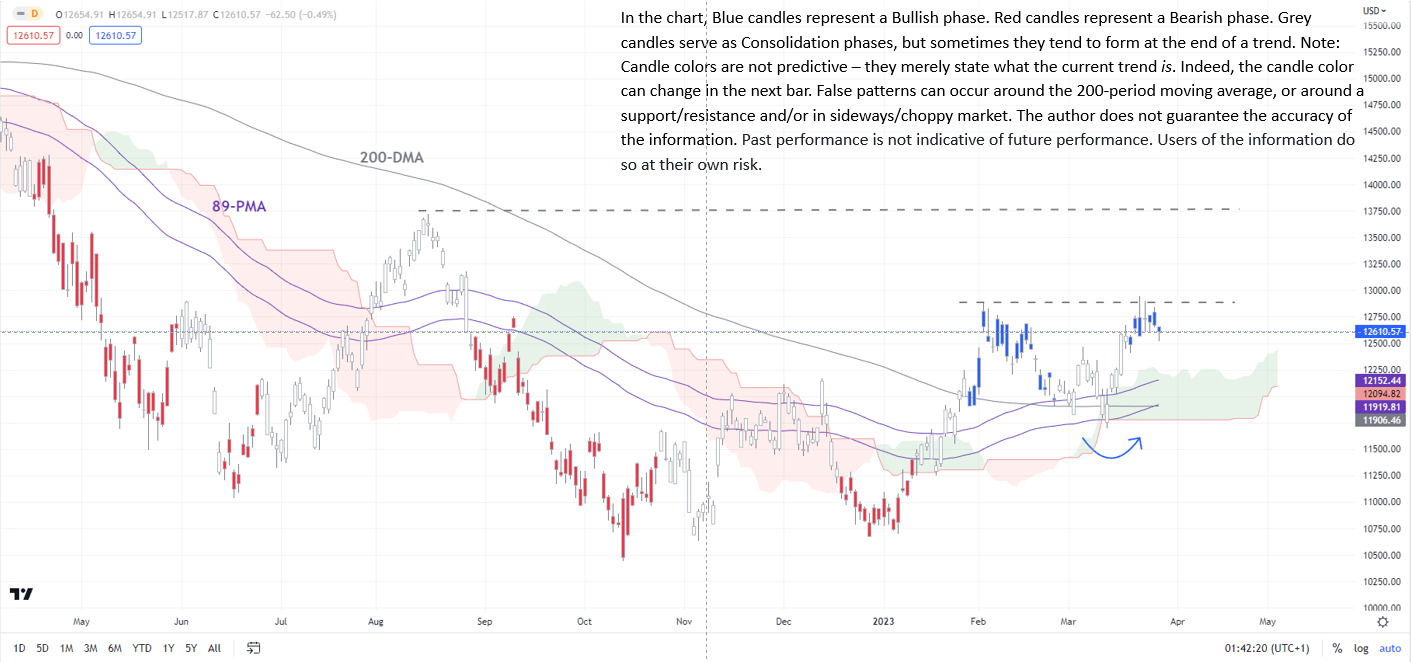
Chart Created by Manish Jaradi Using TradingView
On technical charts, the S&P 500 and the Nasdaq 100 remain in their respective bullish phases,highlighted in February. Importantly, the indices haven’t broken any key support in recent weeks. Potential catalysts in the near term include US core PCE price index data for February due Friday, the Fed’s H.8 banking data (for more details see “EUR/USD Doesn’t Look Ripe for a Break Above 1.10 Ahead of H.8 Data”, published March 28) due Friday, and US quarterly earnings season that kicks off in a couple of weeks.
S&P 500 Daily Chart
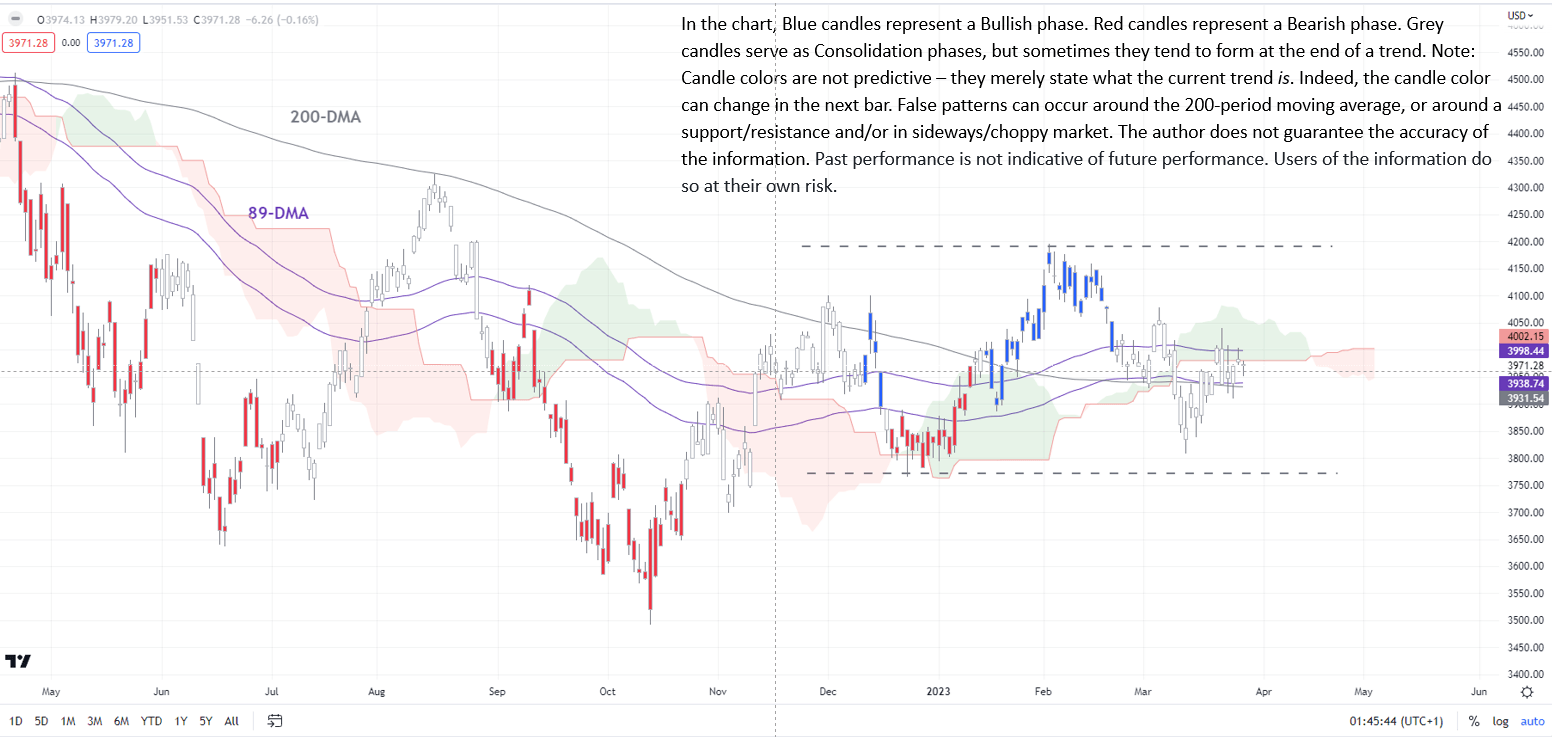
Chart Created by Manish Jaradi Using TradingView
S&P 500: Uptrend remains intact
The S&P 500 index has held above quite a strong cushion at the December low of 3765, reaffirming the higher-top-higher-bottom sequence since October 2022.As highlighted in the previous update, only a break below 3765 would confirm that the nascent uptrend had been truncated.
S&P 500 Weekly Chart
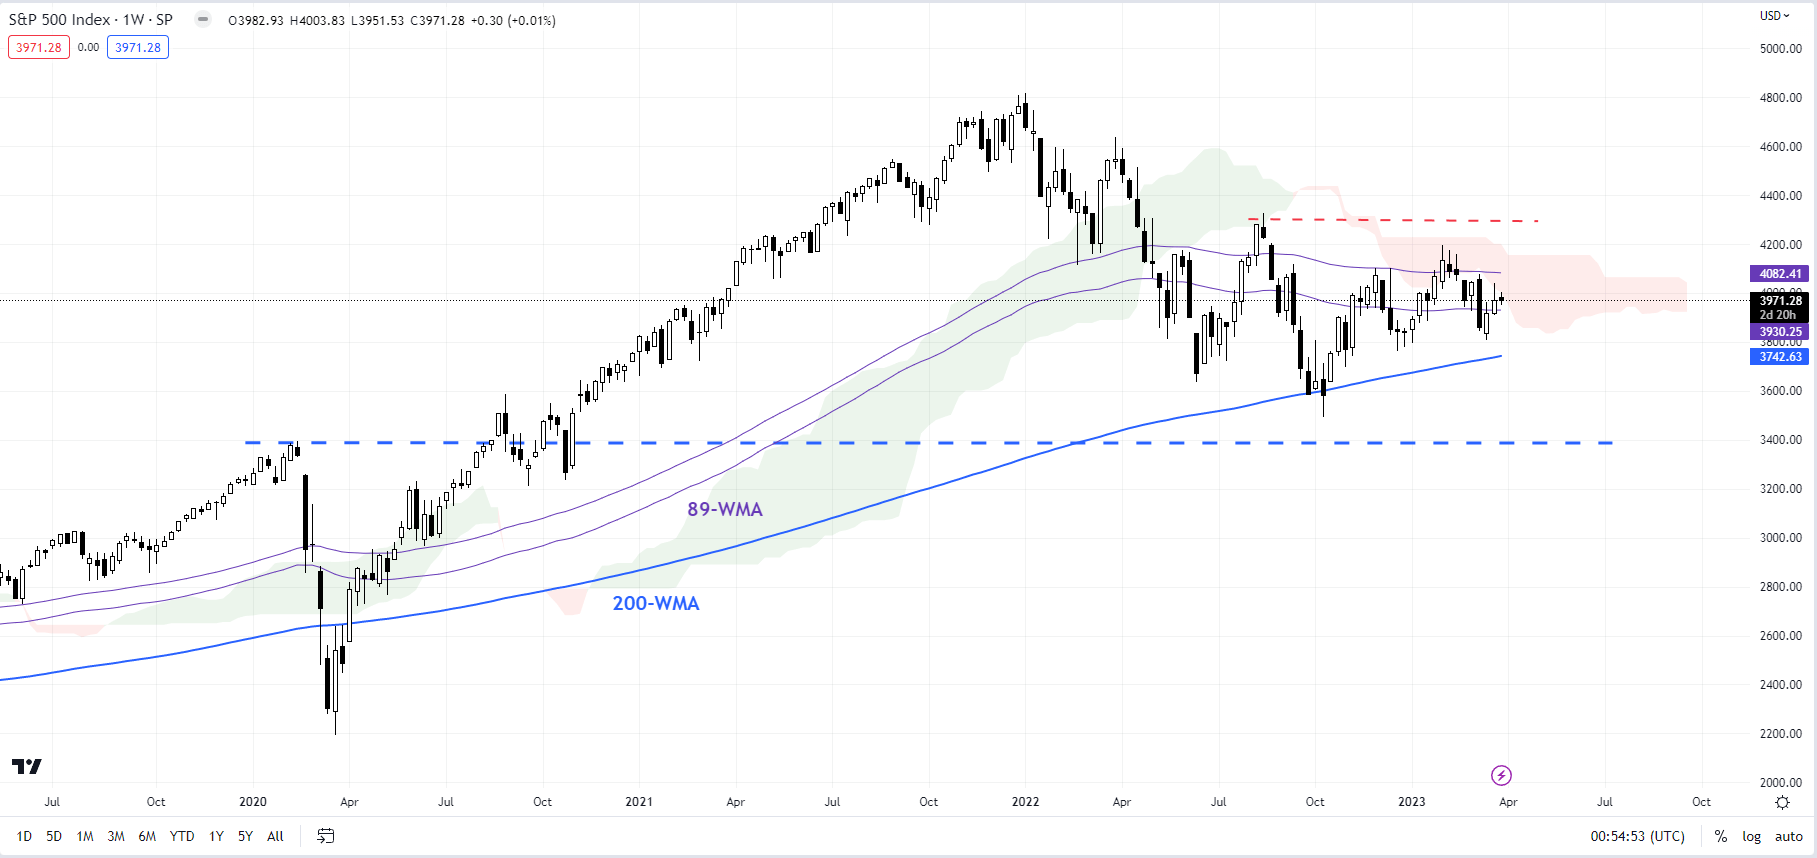
Chart Created by Manish Jaradi Using TradingView
On a relative basis, the S&P 500 index looks marginally weaker compared with the Nasdaq 100 index. The former’s fall below the 89-day moving average and the Ichimoku cloud on the daily chart imply that the bar for the S&P 500 to maintain the uptrend is rising. The index would need a strong catalyst to clear the immediate technical barriers. On the upside, the index would need to clear the February high of 4195 for the uptrend to resume.
NASDAQ 100 Weekly Chart
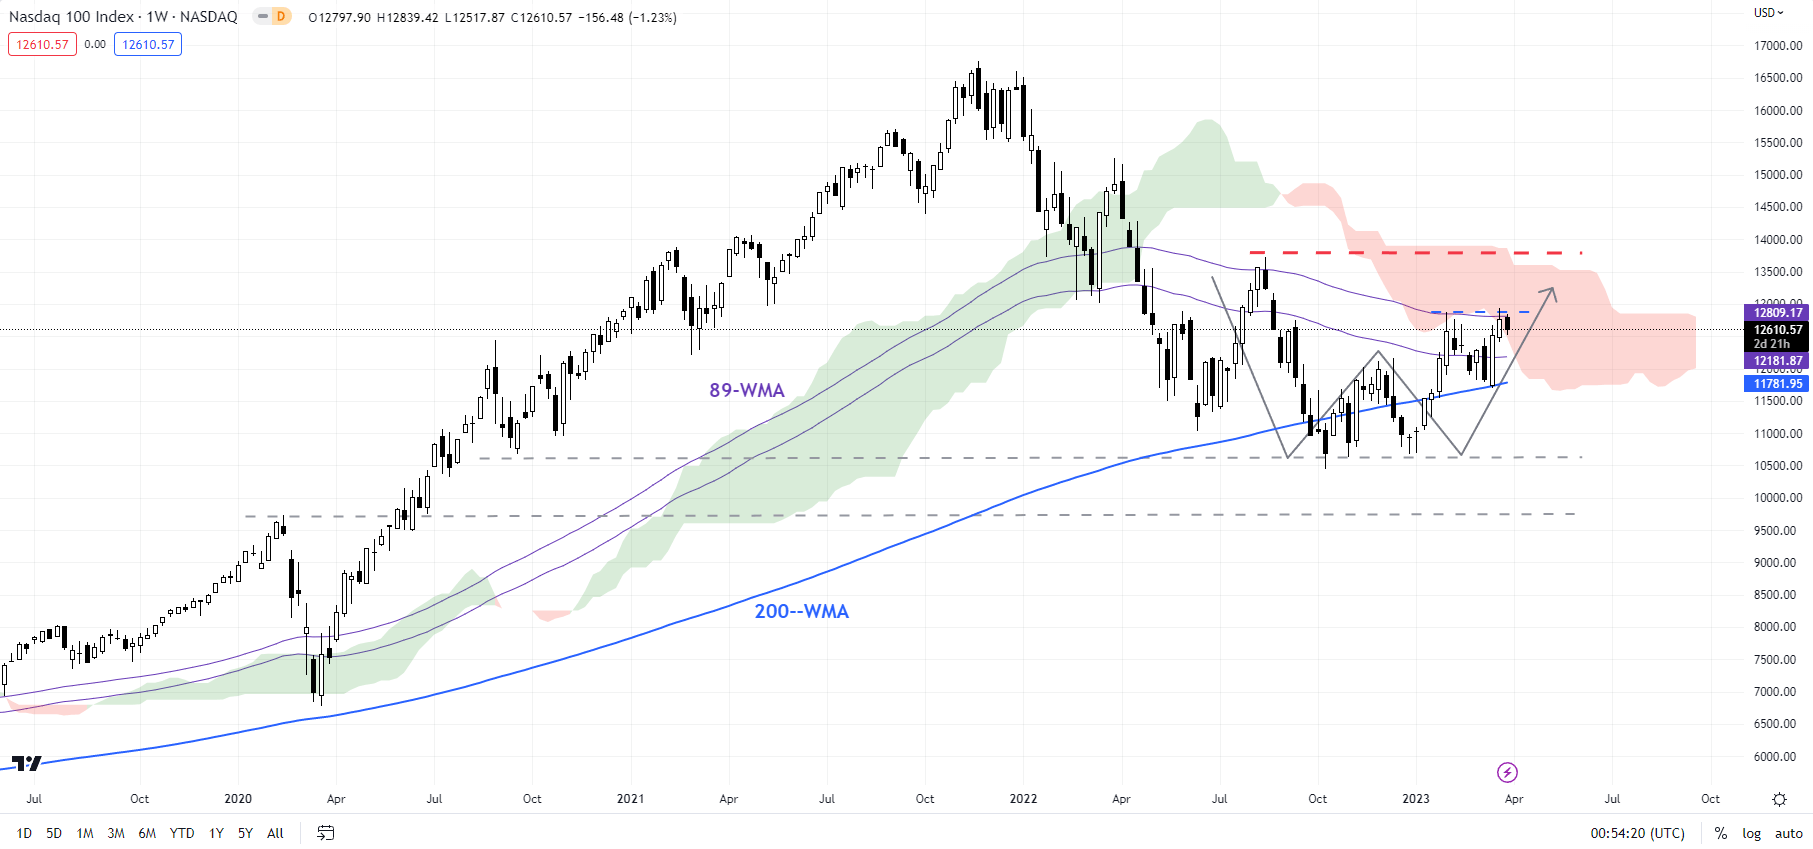
Chart Created by Manish Jaradi Using TradingView
Nasdaq 100: Flirts with resistance
The Nasdaq 100 index has rebounded from a fairly strong converged support area: the 89-, the 200-day moving average, and the lower edge of the Ichimoku cloud on the daily chart. In the process, the index has developed a higher low (relative to its end-2022 low). However, the index needs to rise above the February high of 12880 for the uptrend to be confirmed. Such a break could clear the path for a retest of the August high of 13720.
Trade Smarter - Sign up for the DailyFX Newsletter
Receive timely and compelling market commentary from the DailyFX team
--- Written by Manish Jaradi, Strategist for DailyFX.com
--- Contact and follow Jaradi on Twitter: @JaradiManish


