


NZD/USD, NEW ZEALAND DOLLAR - Technical Outlook:
- New Zealand Dollar’s recent minor uptrend is intact.
- NZD/USD is now faces one of the most significant resistances it has done in months.
- What is the outlook and the key levels to watch?

NZD/USD SHORT-TERM TECHNICAL FORECAST – NEUTRAL
The New Zealand Dollar has maintained a steady ascent against the US Dollar in recent weeks and there is no sign of a reversal of the uptrend. However, NZD/USD is now at one of the most significant resistance areas that it has faced in months.
NZD/USD is testing a converged ceiling on the 89-day moving average, a downtrend line from April and the July low of 0.6060. Slightly above the zone is the major hurdle on the 200-day moving average (now at 0.6325). Since the end of 2021, corrective rallies in NZD/USD have been capped by the two averages. If the rebound from October is corrective, then this resistance zone should hold, and a reversal from there is possible.
NZD/USD Daily Chart
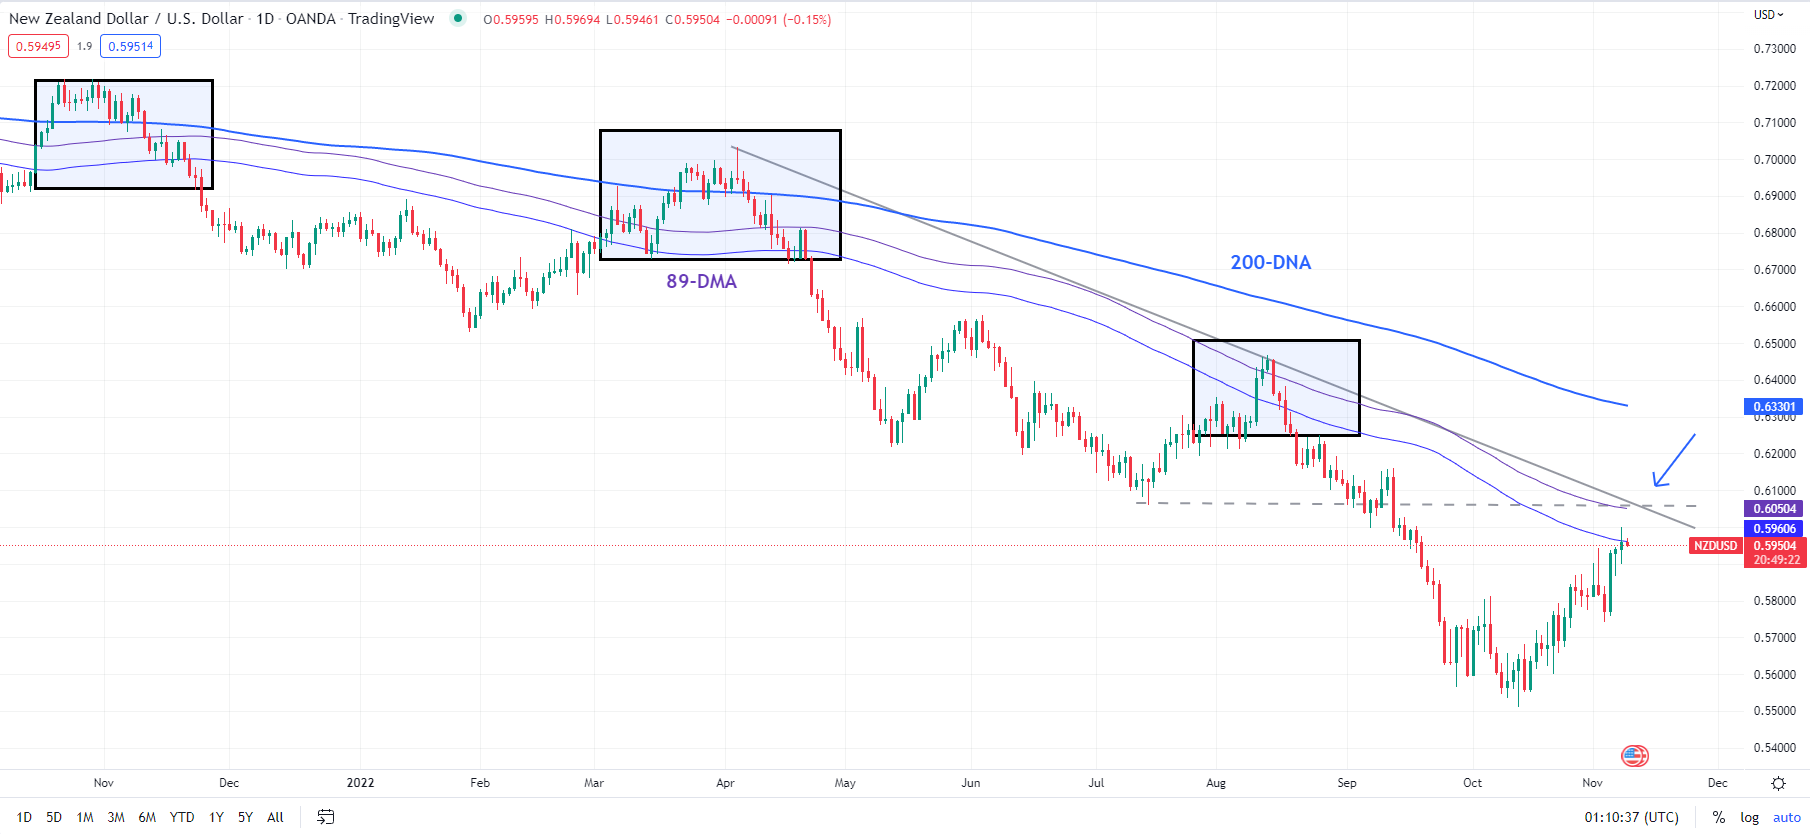
Chart Created Using TradingView
To be sure, there is no sign of reversal of the near-trend uptrend, nor did last week’s setback change the outlook to bearish, as we highlighted. NZD/USD continues to make new highs on the daily chart. As the 240-minute chart shows, the break of the internal trendlines within a rising channel from October indicates that the pair has gradually been shifting to ‘higher gears’ over the past few weeks.
So, for any reversal to occur, the pair needs to stop making new highs at the very least. A continuation of the higher-highs-higher-lows pattern could push the pair toward the 200-day moving average, which would be tough to crack, at least on the first attempt.
NZD/USD 4-Hour Chart
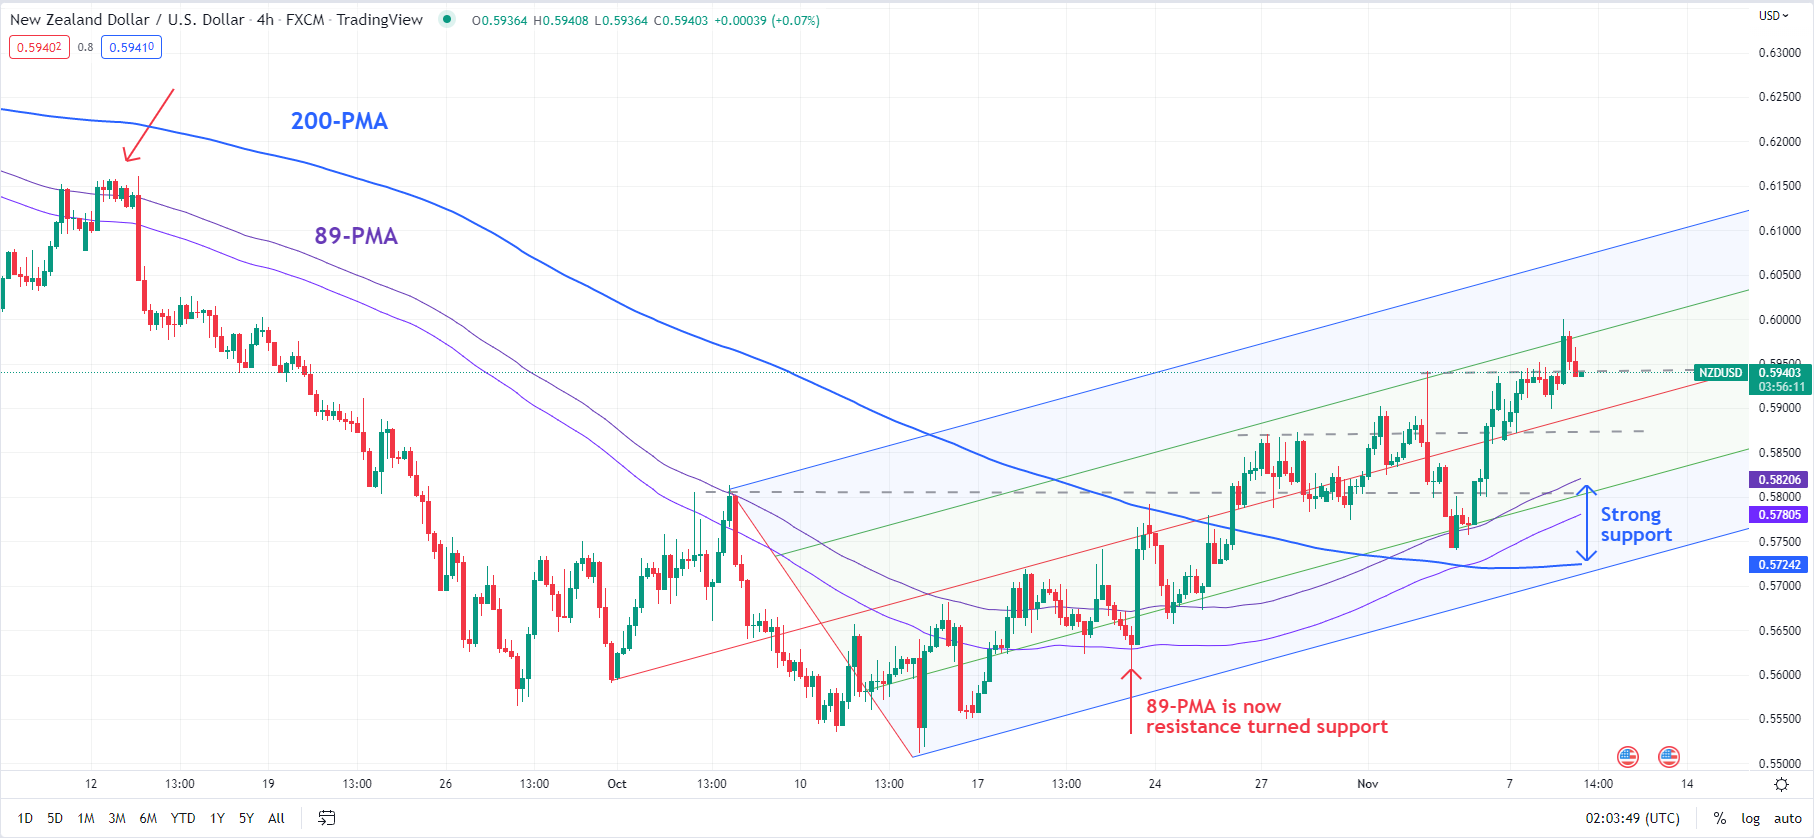
Chart Created Using TradingView
On the downside, one of the initial signposts to watch for a stalling in the rally would be a fall below a horizontal trendline from the end of October at about 0.5870. This would be an early indication that short-term upward pressure is beginning to fade. There is strong support at the 89-period moving average and the 200-period moving average on the 240-minute charts (at about 0.5700-0.5800). NZD/USD needs to hold above this area if the rebound from October is to continue.

--- Written by Manish Jaradi, Strategist for DailyFX.com


