


NZD/USD, NEW ZEALAND DOLLAR - Technical Outlook:
- New Zealand Dollar selloff hasn’t broken any support on intraday charts.
- The minor/corrective uptrend remains intact despite Wednesday’s slide.
- No change in NZD/USD’s medium-term downtrend.

NZD/USD SHORT-TERM TECHNICAL FORECAST – NEUTRAL
The sharp intraday drop in NZD/USD on Wednesday hasn’t reversed the short-term picture from ‘bullish’ to ‘bearish’ just yet.
NZD/USD has maintained a choppy uptrend since the middle of October, well-guided within a rising channel. Most recently, the pair has spent more time toward the upper edge of the channel, indicating relative strength, and has made higher highs this week on the 240-minute (4-hour) charts. The sharp retreat may reiterate the short-term ‘neutral’ stance,outlined on Tuesday, rather than an outright bearish one.
NZD/USD 4-Hour Chart
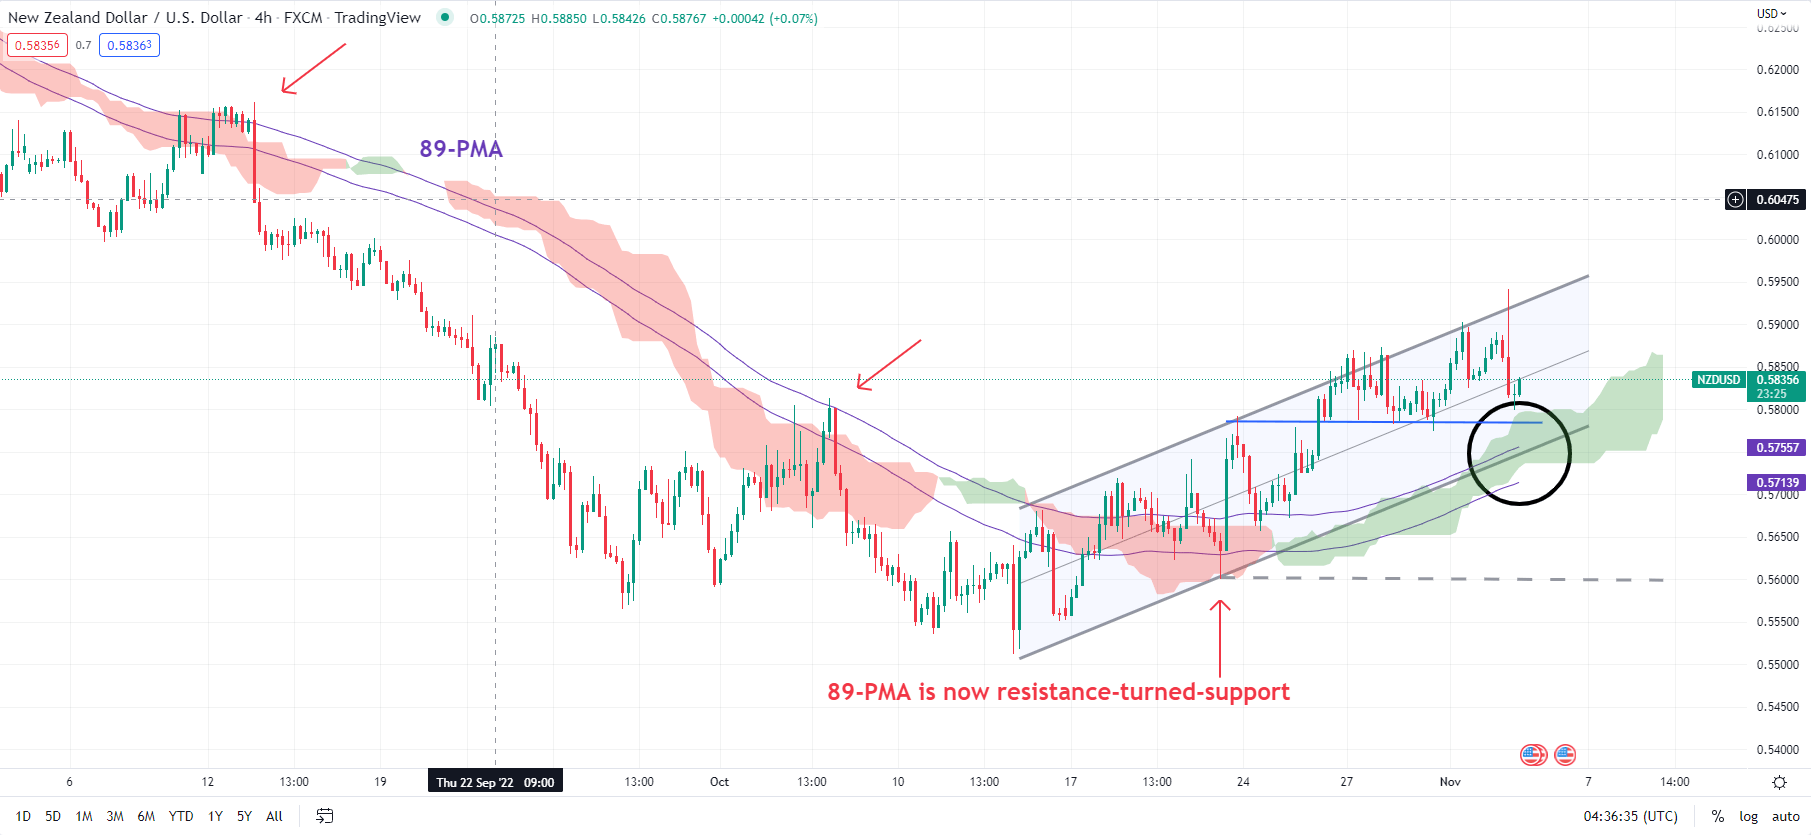
Chart Created Using TradingView
For sellers to claim the upper hand, NZD/USD would need to break below the October 21 low of 0.5597. Immediate support is at Monday’s low of 0.5773. This is followed by converged support marked by the 89-period moving average on the 240-minute chart, which roughly coincides with the lower edge of the Ichimoku cloud.
The choppy nature of the rally since October suggests that it is corrective, pointing to a neutral stance from the perspective of a few weeks’ worth of price action, instead of a bullish one. NZD/USD would need to clear the 200-day moving average for the medium-term outlook to turn constructive. Since the downtrend began last year, the 89- and 200-day moving averages have capped corrective rallies (see chart).
NZD/USD Daily Chart
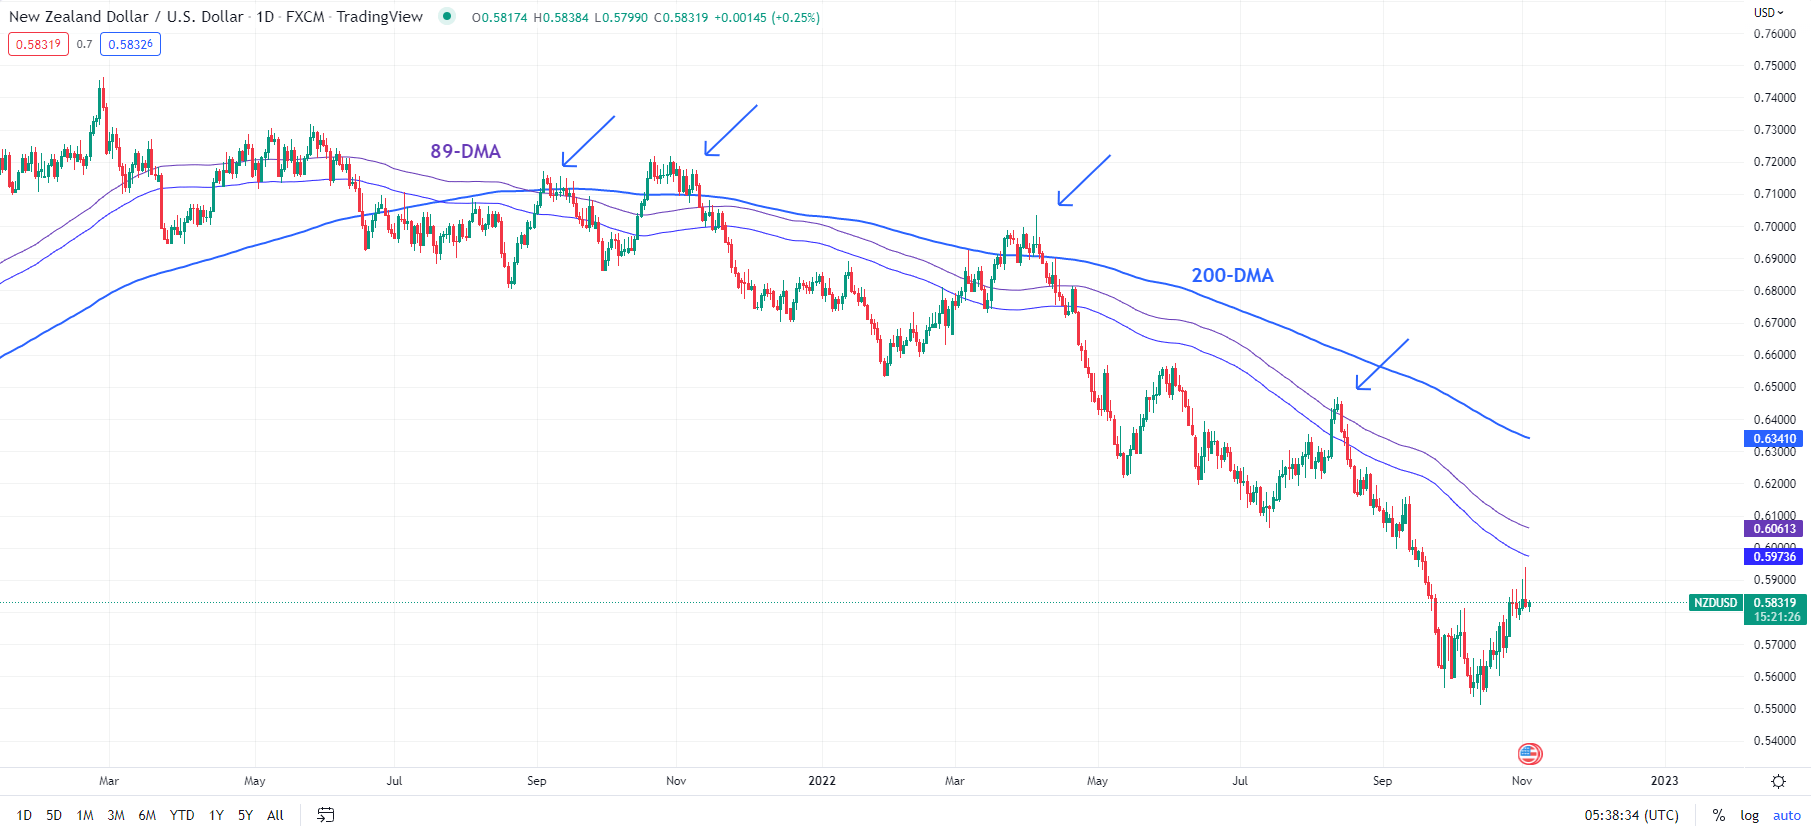
Chart Created Using TradingView
Zooming out, the Moving Average Convergence Divergence (MACD) indicator – a measure of trend and momentum – remains in negative territory on the weekly and monthly charts. This indicates that the broader trend points lower. Granted, medium-term downward momentum has slowed recently (also a reflection of the corrective rebound), but the bearish bias hasn’t reversed (see chart).
NZD/USD Weekly Chart
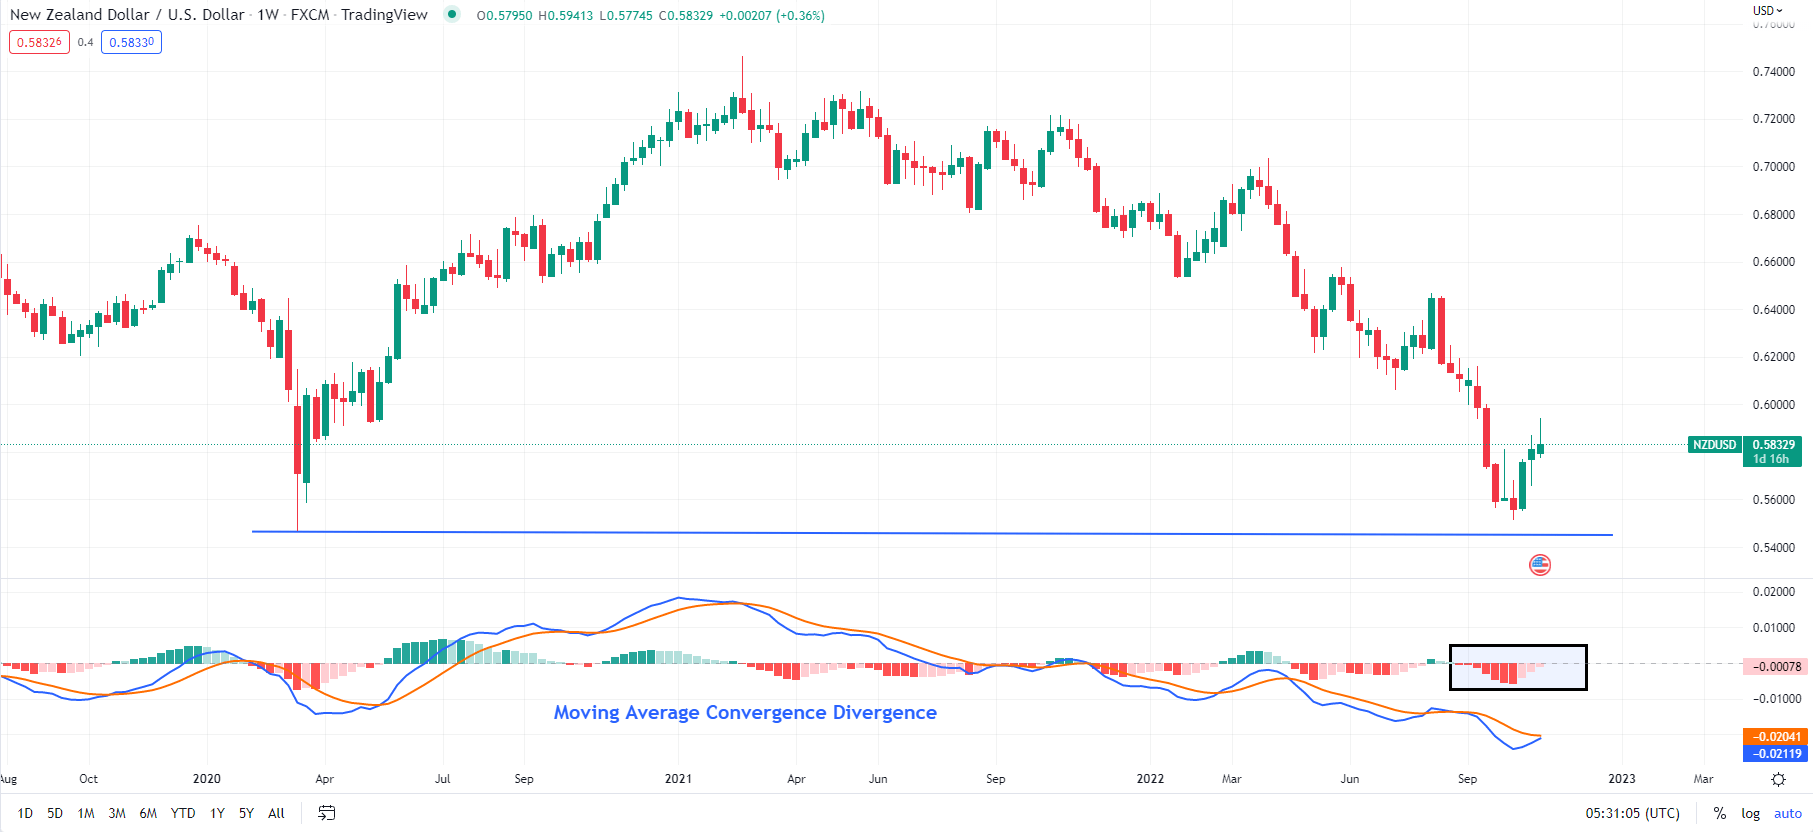
Chart Created Using TradingView
Immediate resistance is at 0.5950-0.6030 (including yesterday’s high and the 89-day moving average), followed by stronger resistance on the 200-day moving average (now at about 0.6340).

--- Written by Manish Jaradi, Strategist for DailyFX.com


