


Natural Gas, NG - Technical Outlook:
- The recent rebound in natural gas prices looks corrective.
- A major double top pattern points to further downside in natural gas.
- What are the key levels to watch?

NATURAL GAS TECHNICAL OUTLOOK - BEARISH
Natural gas prices may have rebounded materially in recent days, but so far it looks like a pause, rather than a reversal of the downtrend, even on some intraday timeframes.
US natural gas prices jumped to a one-week high on Tuesday despite forecasts for a largely warmer-than-usual period through Feb. 22. Also aiding gas prices is the growing view that Freeport LNG’s export plant in Texas would soon start to pull in more gas in the coming weeks after the company told regulators last week that it would start sending gas to one of three liquefaction trains at its long-closed export plants.
Natural Gas 240-minutes Chart
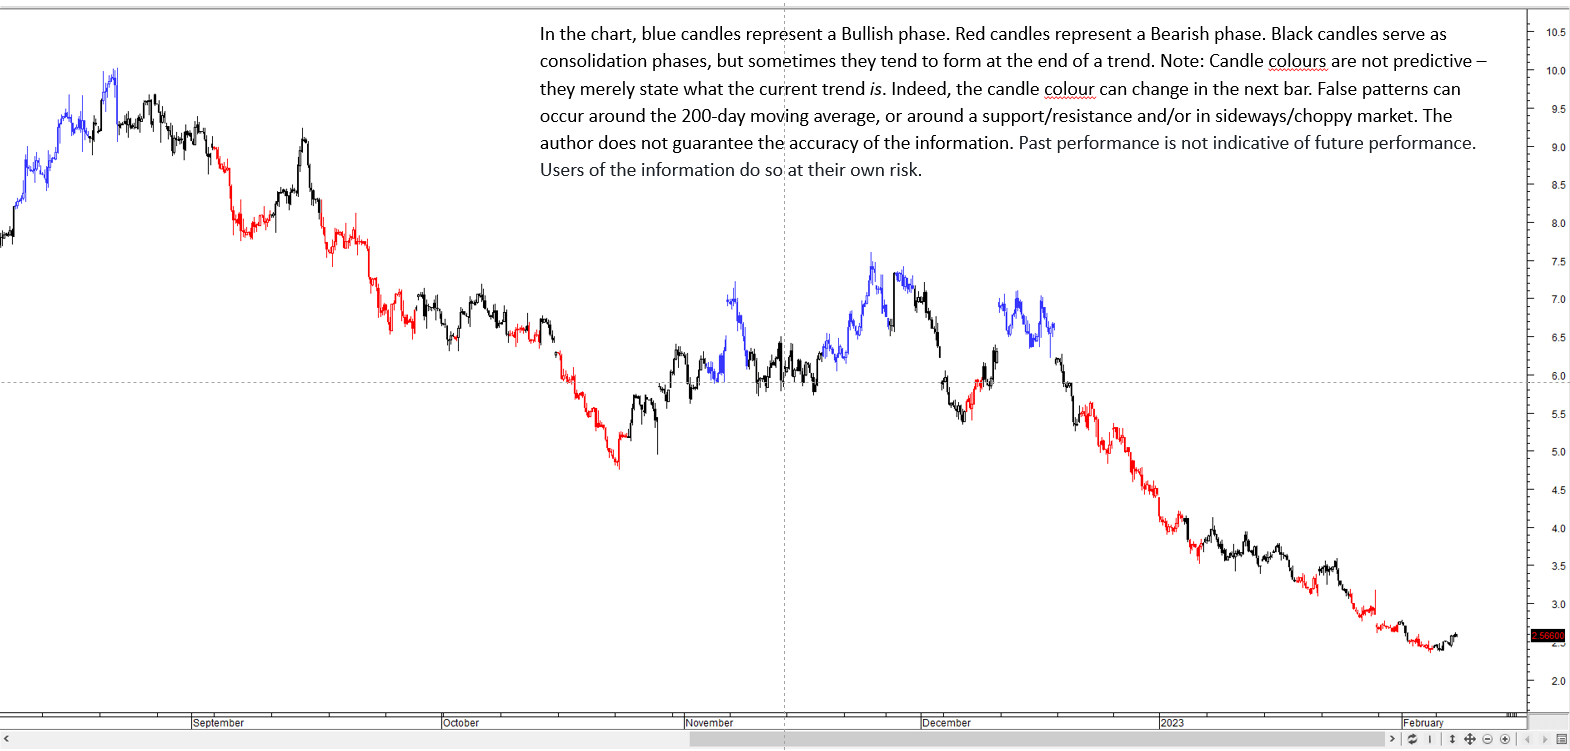
Chart created by Manish Jaradi using Metastock
On technical charts, the bounce still looks like a pause/consolidation in the slide, at least yet (see 240-minute colour-coded chart). For instance, the 14-period Relative Strength Index on the 4-hour timeframe is still under 55 (corrective rallies tend to be capped around 50-55). Granted, the price action is still unfolding and the bounce could well extend, pushing RSI higher.
Natural Gas 240-minutes Chart
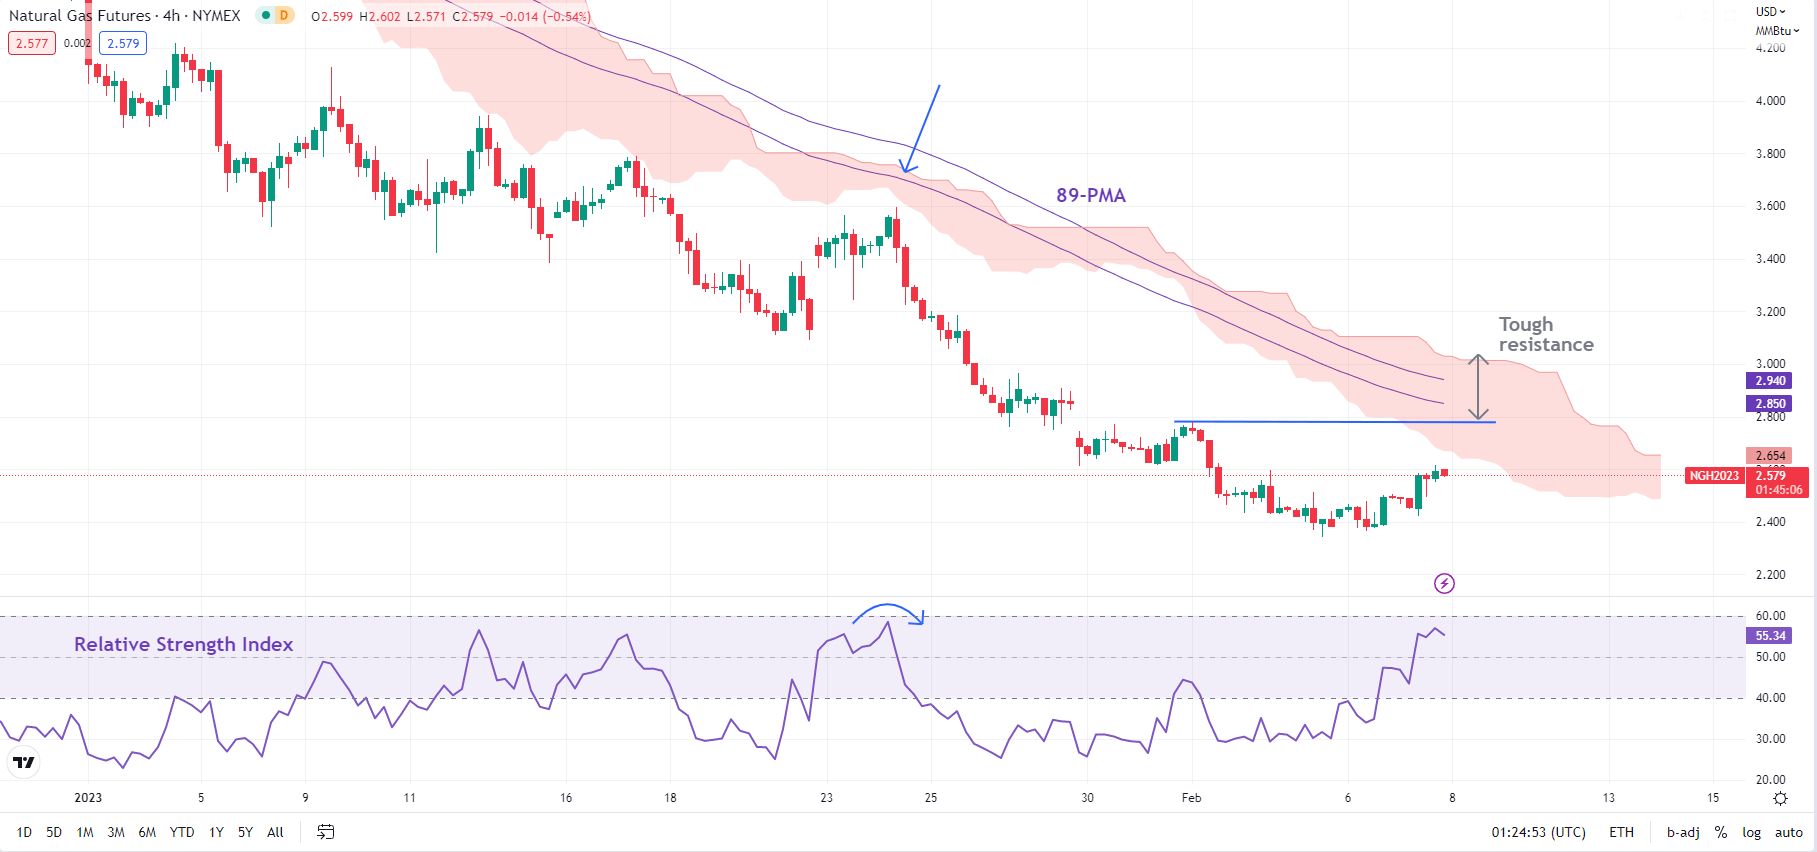
Chart Created Using TradingView
However, unless natural gas stays below tough converged resistance at the last week’s high of 2.78, the 89-period moving average on the 240-minute chart, and the Ichimoku cloud cover (at about 3.00), the path of least resistance is sideways to down. On the daily charts, the trend remains down (see the colour-coded daily chart).
Natural Gas Daily Chart
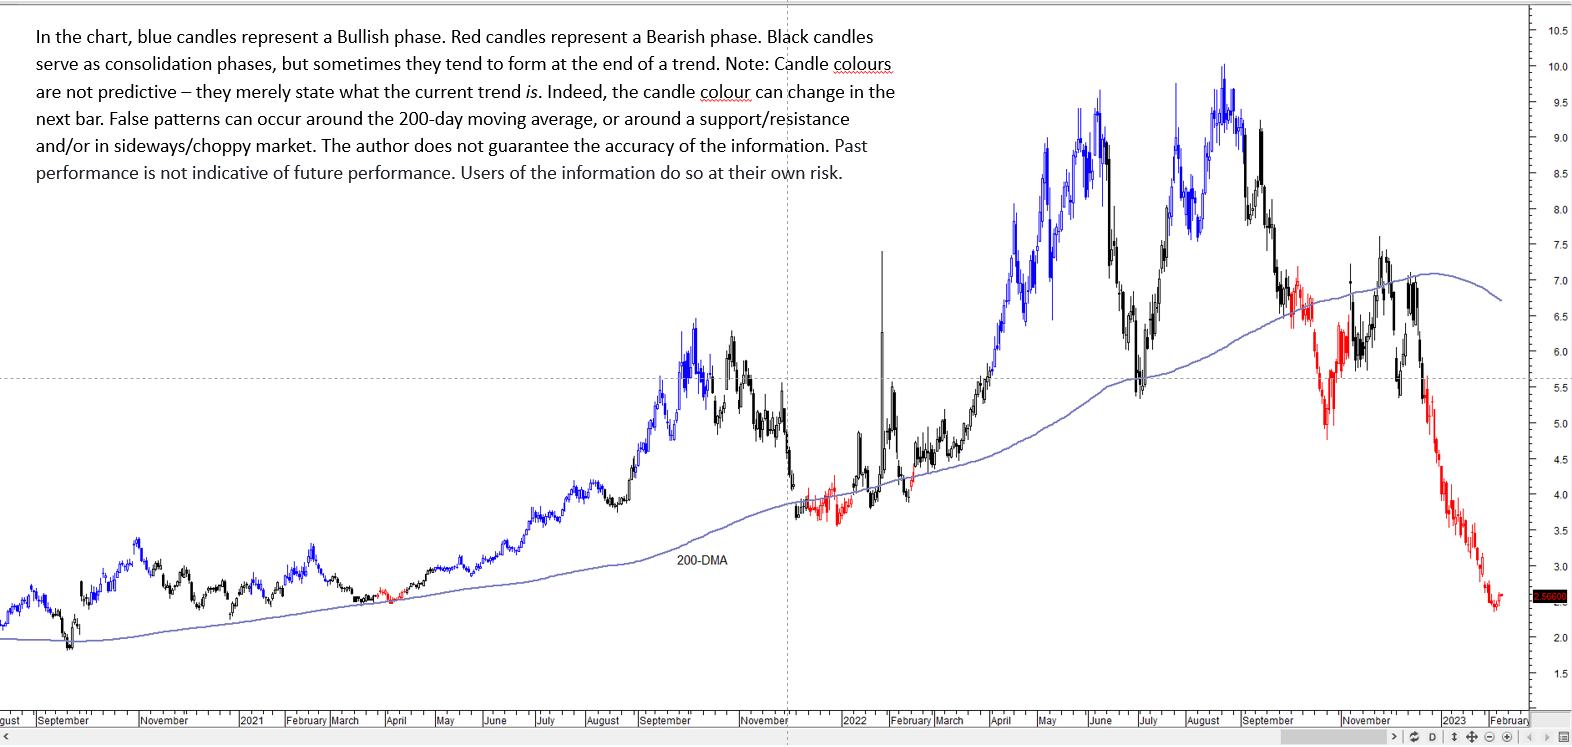
Chart created by Manish Jaradi using Metastock
Moreover, as highlighted in the previous update, a major double-top pattern (the 2022 highs) triggered at the end of last year points to further downside in natural gas, potentially toward the 2020 low of around 1.45 (see weekly chart). Immediate support is at last week’s low of 2.34, near the end-2020 low of 2.25. Subsequent support is a horizontal trendline from 1999, at about 1.45-1.50.
--- Written by Manish Jaradi, Strategist for DailyFX.com


