


Natural Gas, Strongest Weekly Rally Since Mid-July – Technical Update:
- Natural gas prices rallied the most since July last week
- This continues to offer a near-term bullish perspective
- It remains difficult to overturn the broader bearish view
Trade Smarter - Sign up for the DailyFX Newsletter
Receive timely and compelling market commentary from the DailyFX team
Weekly Chart – Best Week Since July
Natural gas prices soared 18.09% last week, marking the best 5-day performance since the middle of July. Prices were unable to hold a close under the March 2021 low at 2.422 in recent weeks as the heating commodity found support. Now, on the weekly chart below, prices have turned higher toward the December 2021 low at 3.536. This price could hold as resistance, establishing an inflection point. Despite the near-term shift, the broader technical focus remains bearish.
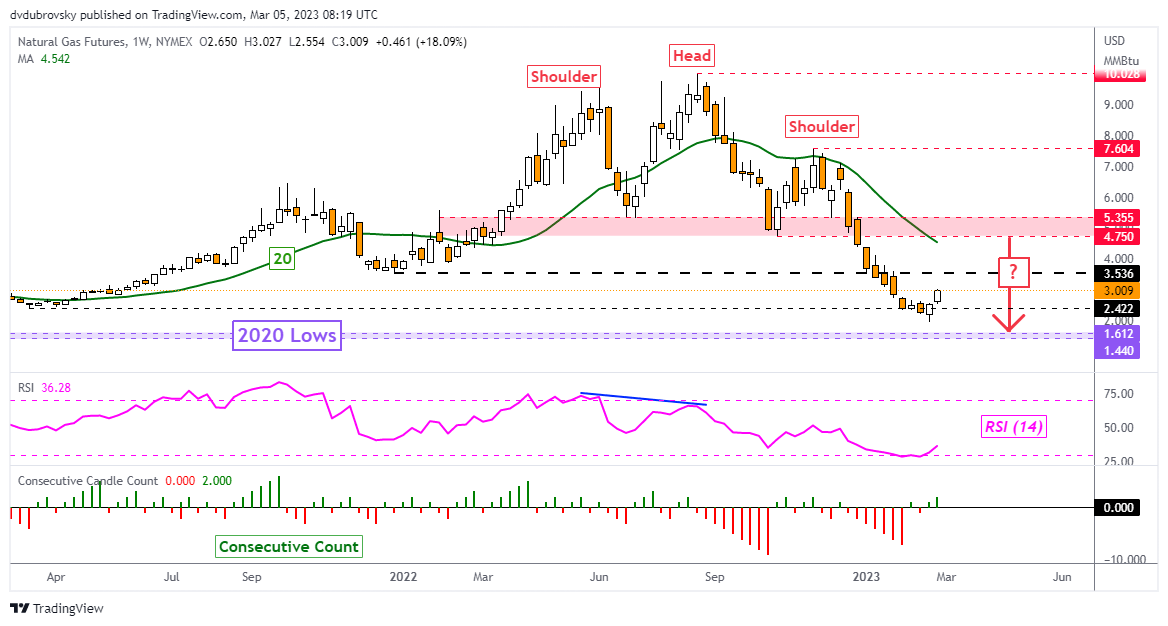
Chart Created Using TradingView
Daily Chart – Eyes on the 50-Day SMA
On the daily chart, natural gas has confirmed a breakout above the 20-day Simple Moving Average (SMA). Now, prices are quickly approaching the 23.6% Fibonacci retracement level at 3.2973 as well as the 50-day SMA. This will be a key area to watch in the week ahead. If resistance is reinforced, this could open the door to a turn lower toward the February low at 1.967. Otherwise, clearing resistance exposes the 38.2% level at 4.1203 before the long-term falling trendline from August comes into focus.
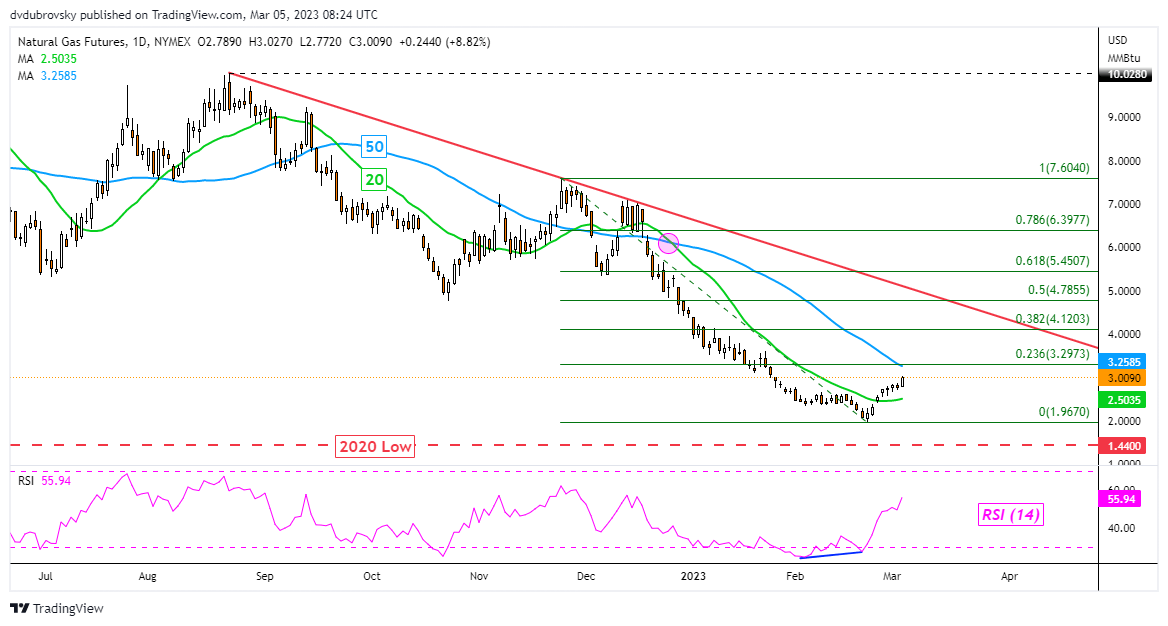
Chart Created Using TradingView
4-Hour Chart – Rising Wedge Still in Play
Zooming in on the 4-hour chart for a better near-term picture, natural gas continues to trade within the boundaries of a bearish Rising Wedge chart formation. The immediate technical bias continues to favor the upside so long as the commodity remains within the wedge. Still, in the event of a downside breakout, this could open the door to resuming the downtrend from late January that lasted until the latter half of February. If not, the January 24th peak at 3.595 could soon be in sight.

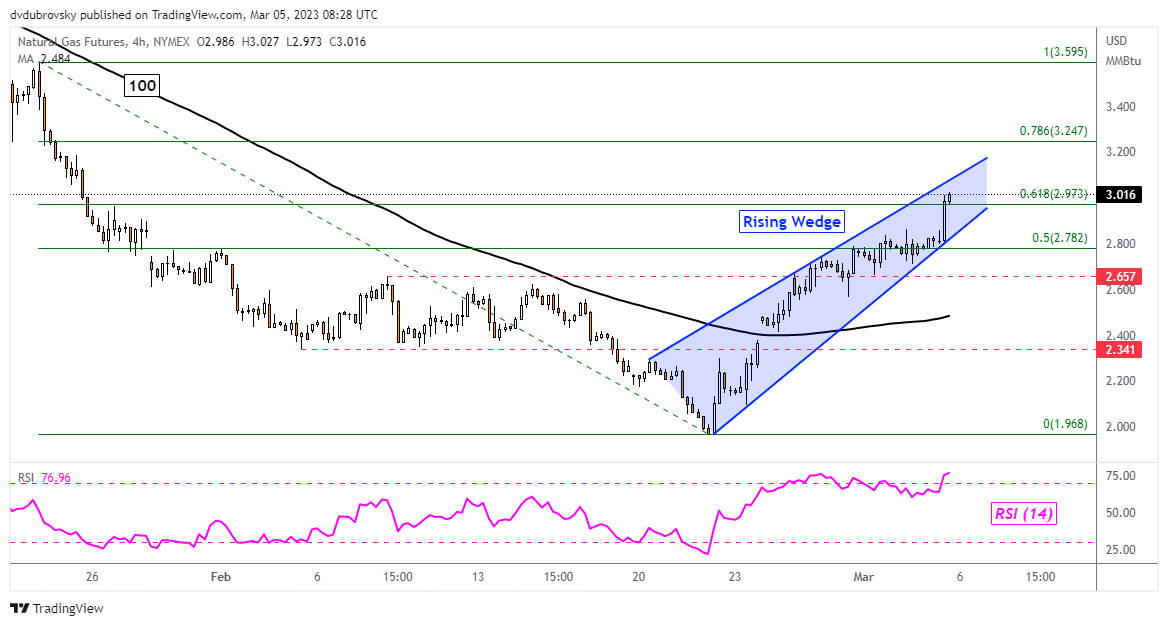
Chart Created Using TradingView
--- Written by Daniel Dubrovsky, Senior Strategist for DailyFX.com
To contact Daniel, follow him on Twitter:@ddubrovskyFX


