


Natural Gas, Head & Shoulders, 20-day SMA – Technical Update:
- Natural gas prices reversed 2-day win streak, 8th weekly loss next?
- Downside momentum strong, Head & Shoulders trajectory in focus
- Will 2.326 support level hold? Keep an eye on the 20-day SMA
Trade Smarter - Sign up for the DailyFX Newsletter
Receive timely and compelling market commentary from the DailyFX team
Weekly Chart – Head & Shoulders Trajectory Remains in Focus
Following a 7th consecutive weekly loss, Natural Gas prices are little changed as we head into the remainder of the week. A push higher on Monday and Tuesday was reversed on Wednesday, leading the commodity back down toward the March 2021 low of around 2.422. That is standing in the way between prices and lows from 2020 (1.44 – 1.612).
With the downtrend since last year showing few signs of slowing, the bearish Head & Shoulders chart pattern remains in play. The anticipated trajectory could lead prices down to lows from 2020. A lack of RSI divergence continues to show that downside momentum remains strong. Even so, the commodity experienced 9 consecutive weeks of losses during the Fall of 2022. It will take a 10th to set the longest losing streak since 1991.
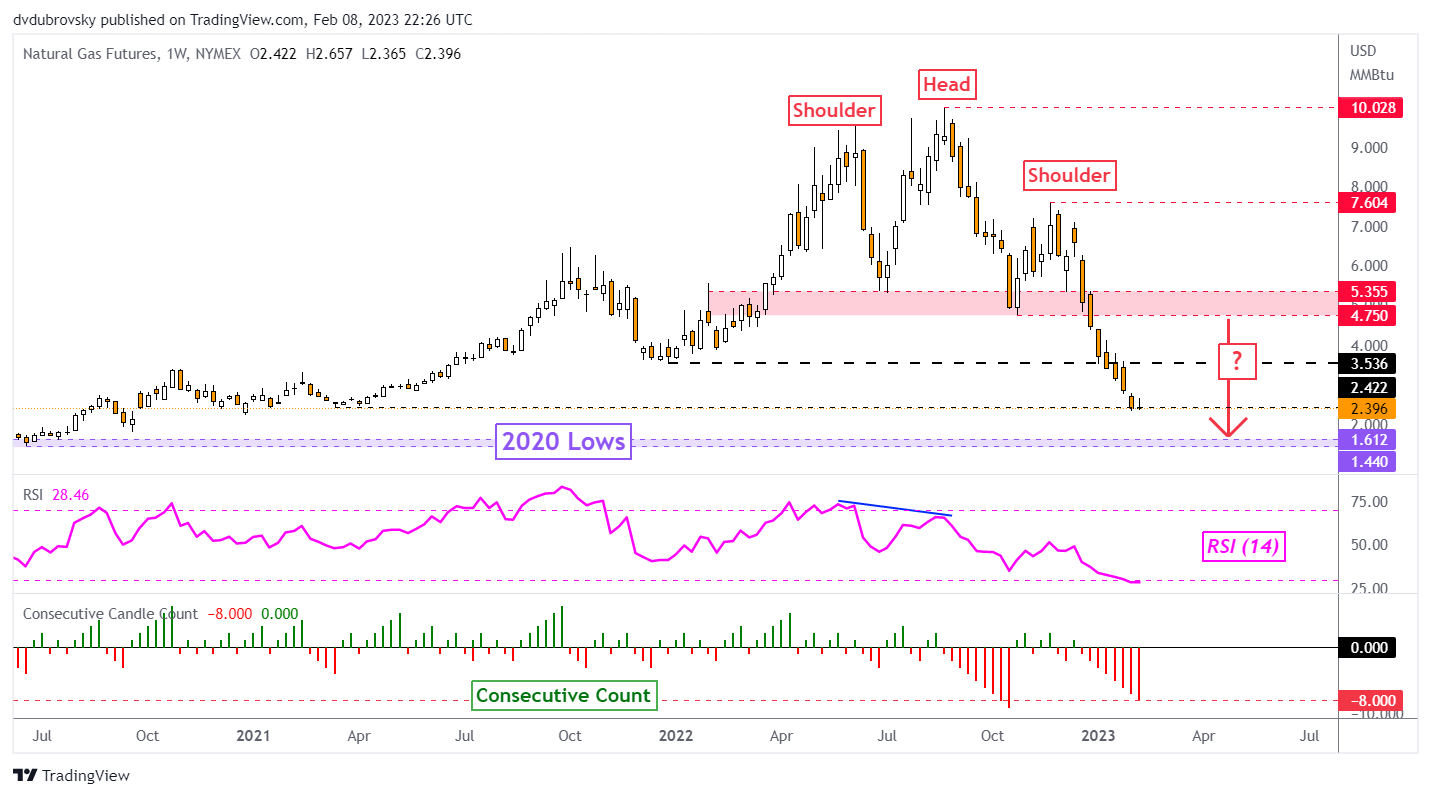
Chart Created Using TradingView
Daily Chart – Bounce off Support Fades
Zooming in on the daily chart will show a better picture of how upside momentum faded over the past 24 hours. Last week, prices fell to the 100% Fibonacci extension level at 2.326 as the downtrend slowed. This established that level as key support. A push higher on Monday and Tuesday was wiped out after prices sank 7.28% over the past 24 hours.
Clearing support exposes the 114.6% Fibonacci extension level at 1.555 toward 2020 lows. In the event of a turn higher, keep a close eye on the 20-day Simple Moving Average (SMA). The latter could hold as resistance, maintaining the downside focus. There hasn’t been a test of this line since the middle of December. Closing above it would place the focus on the December 2021 low at 3.536. This price could establish itself as new resistance.

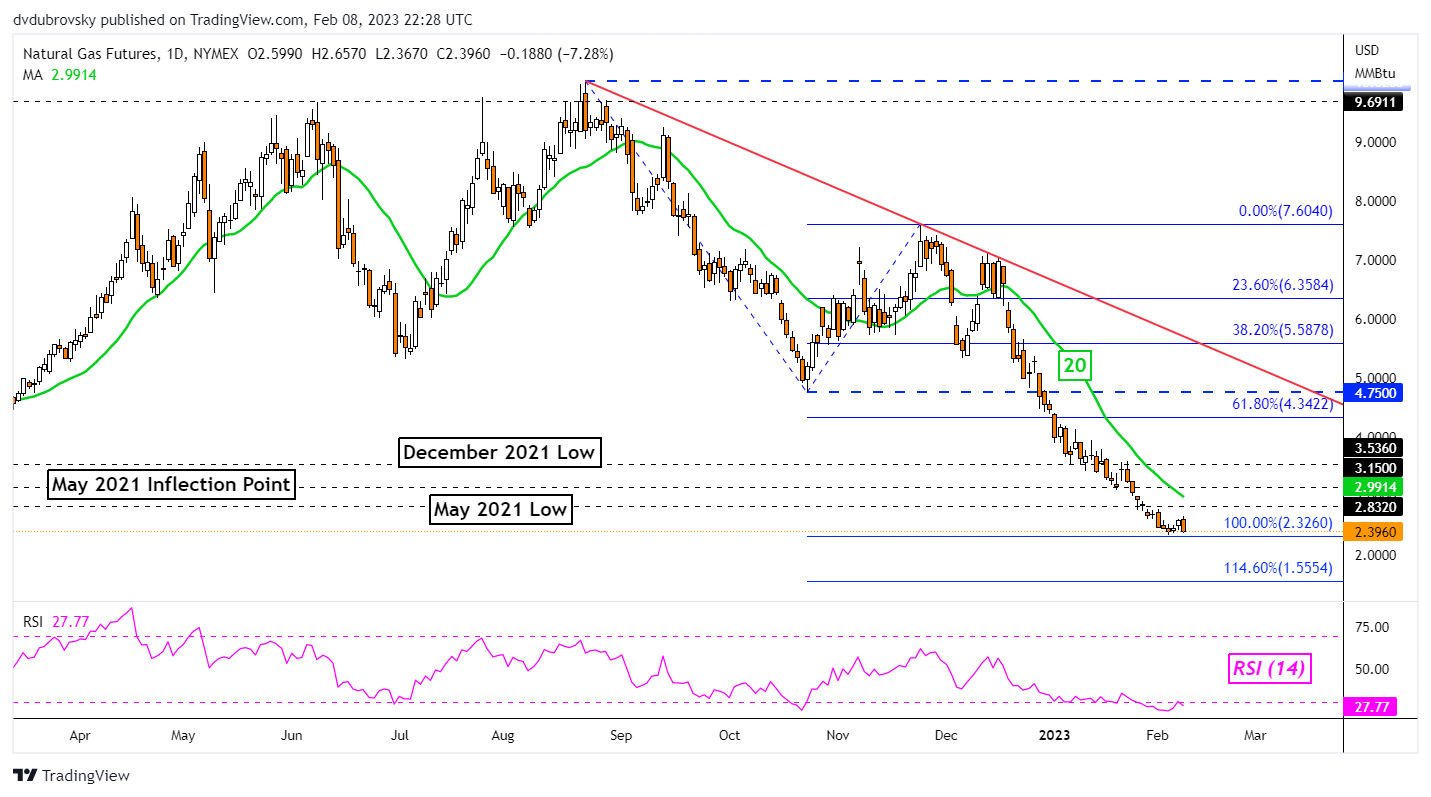
Chart Created Using TradingView
--- Written by Daniel Dubrovsky, Senior Strategist for DailyFX.com
To contact Daniel, follow him on Twitter:@ddubrovskyFX


