


Japanese Yen, USD/JPY, US Dollar, EUR/JPY, Euro - Talking Points
- USD/JPY fell from the clouds last month as it pushed lower
- EUR/JPY ran lower but notable support levels have held for now
- If the Yen keeps strengthening, how low will USD/JPY and EUR/JPY go?
i

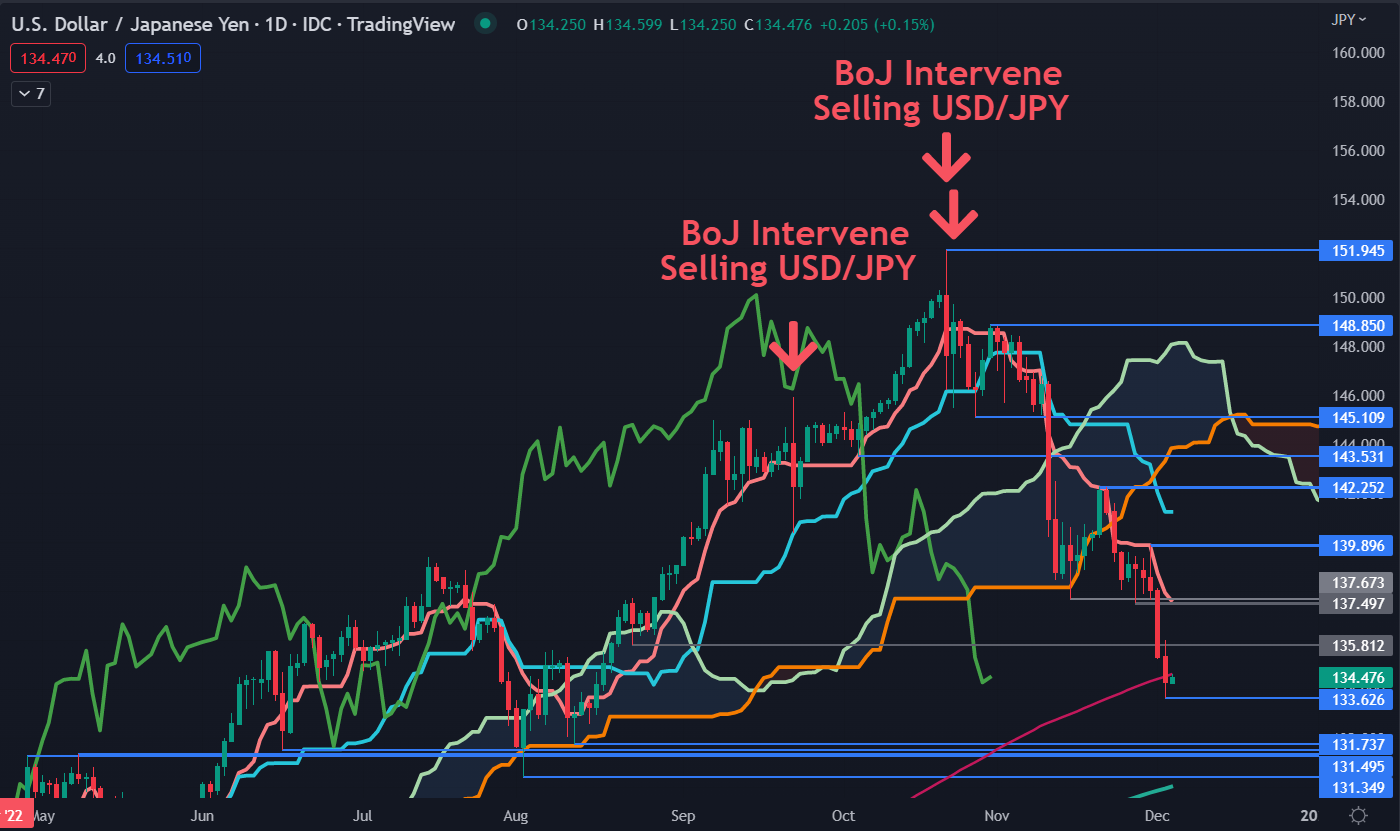
USD/JPY TECHNICAL ANALYSIS
After breaking below the Ichimoku Cloud, USD/JPY bearishness unfolded as it pressed to a 3-month low on Friday at 133.63. That level might provide support in the near term.
Further down there is a cluster of previous lows and breakpoints that may provide support at 131.74, 131.50, 131.35, 131.25 and 130.40.
Under there, the 260-day Simple Moving Average (SMA) is currently at 130.00 and could be a level to watch.
The move lower on Friday also saw the price go below the 200-day SMA. It is now below all SMAs of less than 200-days and this may indicate that bearish momentum is possibly evolving.
Support could be at the previous lows of 137.67 and 135.81 or at the breakpoint of 135.57.
Previous support levels that have been broken might now offer breakpoint resistance at 135.81, 137.50 and 136.67.
Further up, resistance could be at the previous peaks of 139.90 and 142.25.

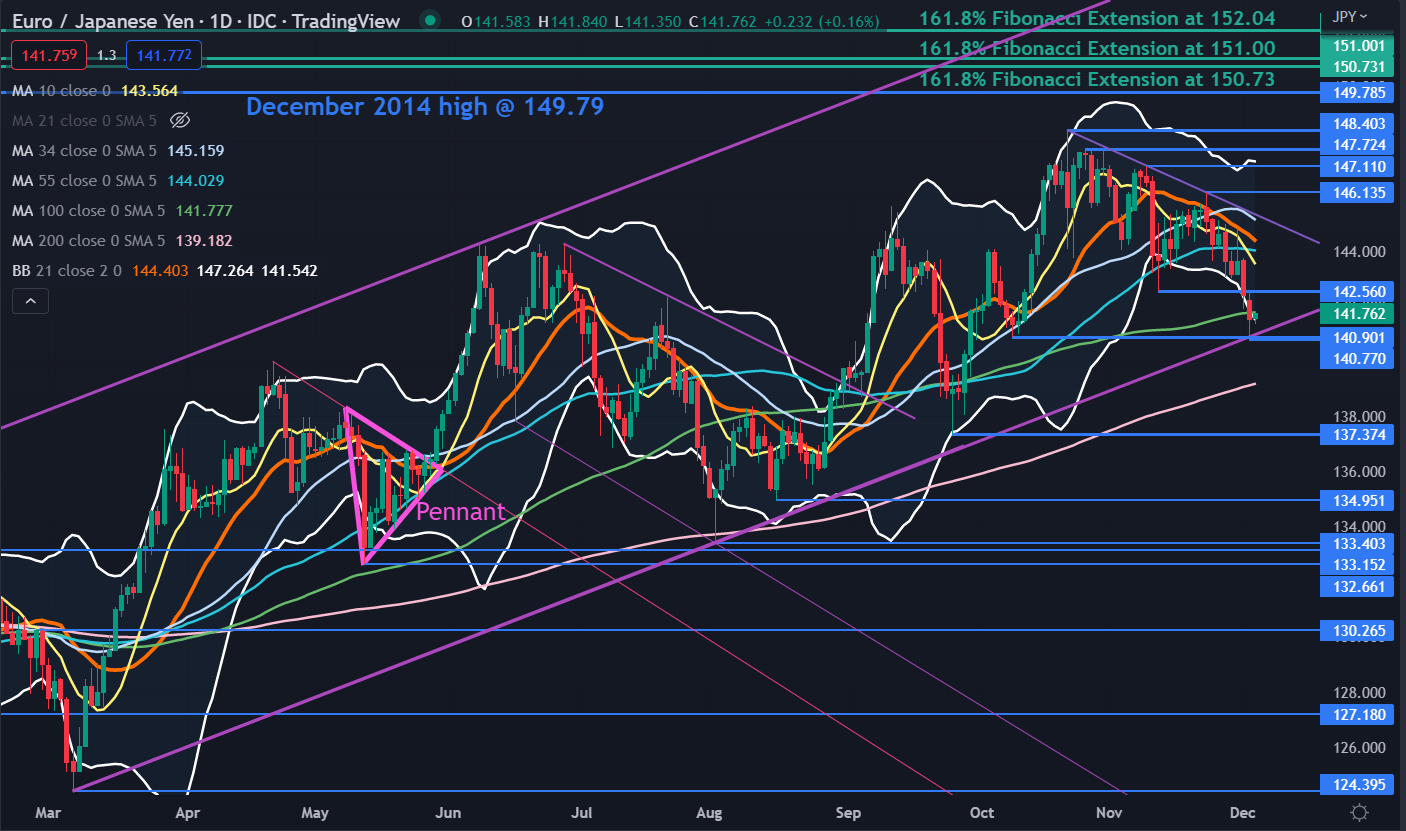
EUR/JPY TECHNICAL ANALYSIS
EUR/JPY tumbled to a 2-month low on Friday but was unable to sustain the move under a previous low at 140.90 when it touched 140.77. These levels might provide support.
That look lower was also unable to penetrate an ascending trend line and it too may provide support, currently intersecting at 141.00.
The close on Friday was at 141.53 which was below the lower band of the 21-day Simple Moving Average (SMA) based Bollinger Band at 141.92 at the time. A close back inside the band could signal a pause in bearishness or a potential reversal.
The price is currently below all SMAs 100-days or less but remains above the 200- and 260-days SMAs. This might indicate that short and medium-term momentum could be bearish but that underlying longer-term momentum is yet to confirm this.
Support may lie at the previous lows of 137.37, 134.95 and 133.40. On the topside, resistance might be offered at the breakpoint of 142.56 or the prior peaks at 146.14, 147.11, 147.72 and 148.40.
Resistance could also be offered at the December 2014 peak of 149.79. Beyond there, a series of Fibonacci Extension levels may offer resistance at 150.73, 151.00 and 152.04.
--- Written by Daniel McCarthy, Strategist for DailyFX.com
To contact Daniel, use the comments section below or @DanMcCathyFX on Twitter


