


Japanese Yen, USD/JPY, US Dollar, EUR/JPY, Euro - Talking Points
- USD/JPY remains in a descending trend channel but is challenging resistance
- EUR/JPY has cleared a trend line today, but headwinds might lie ahead
- If the Yen keeps weakening, how high will USD/JPY and EUR/JPY go?

USD/JPY TECHNICAL ANALYSIS
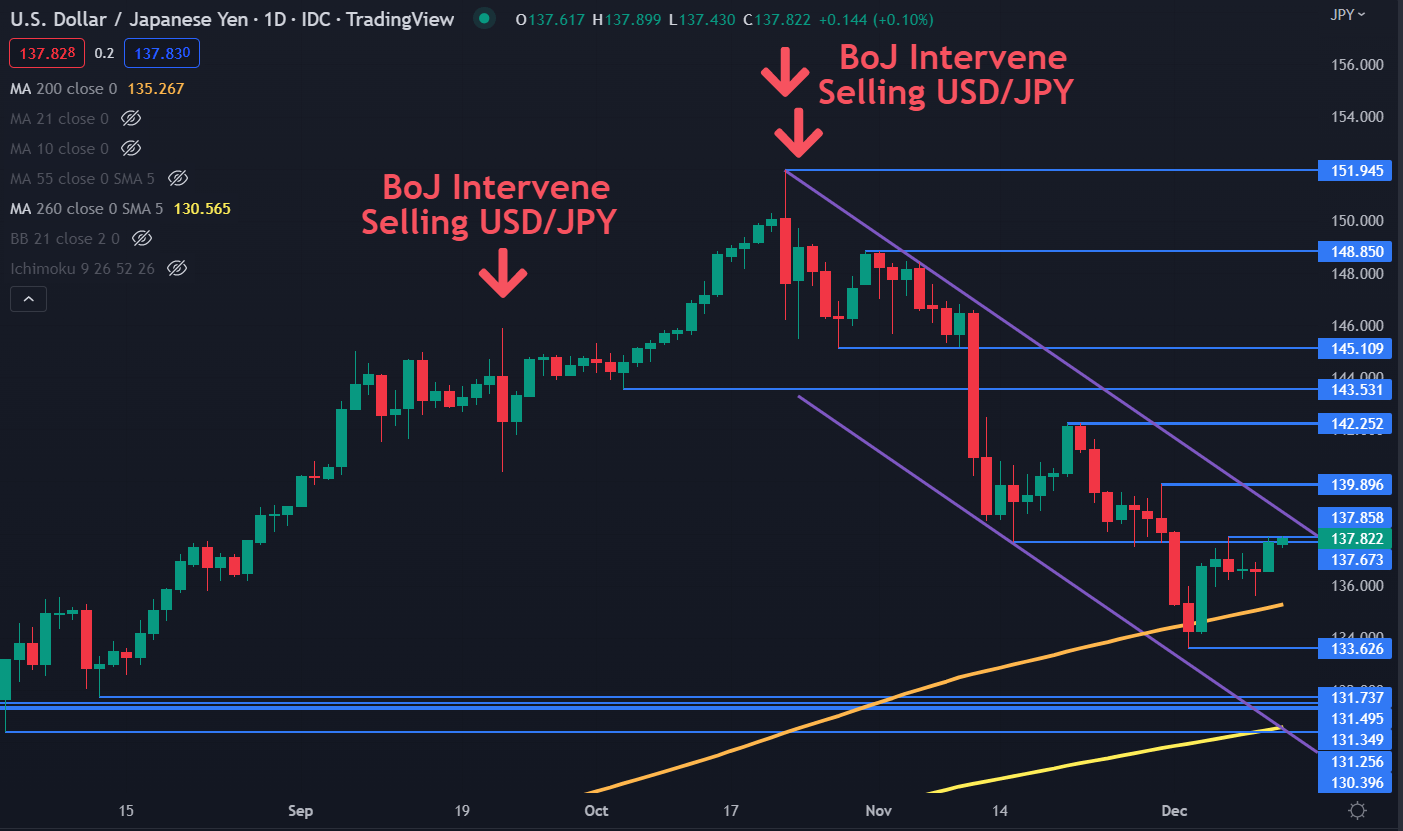
USD/JPY made a 32-year high in October at 151.95 on the day that the Bank of Japan intervened for the second time to prevent the Yen from depreciating. Since that peak, the price has been within a descending trend channel.
The 4-month low of 133.63 made at the start of the month was above the lower band of the descending trend channel.
The price is now approaching the upper band of the channel, but it is struggling to move above a breakpoint and a recent peak at 137.67 and 137.86 respectively.
A clean break above these levels might see the descending line tested and moving above it could indicate the bearish run is pausing or possibly has ended. Further up, resistance might be at the previous highs and breakpoints of 139.90, 142.25, 143.53 and 145.11.
Support could be at the recent low of 133.63 or the 200-day Simple Moving Average (SMA). The recent dip below the 200-day SMA was rejected by the market.
Further down there is a cluster of previous lows and breakpoints that may provide support at 131.74, 131.50, 131.35, 131.25 and 130.40.
130.40 might have more weight from the lower bound of the descending trend channel and the 260-day SMA that are nearby.

EUR/JPY TECHNICAL ANALYSIS
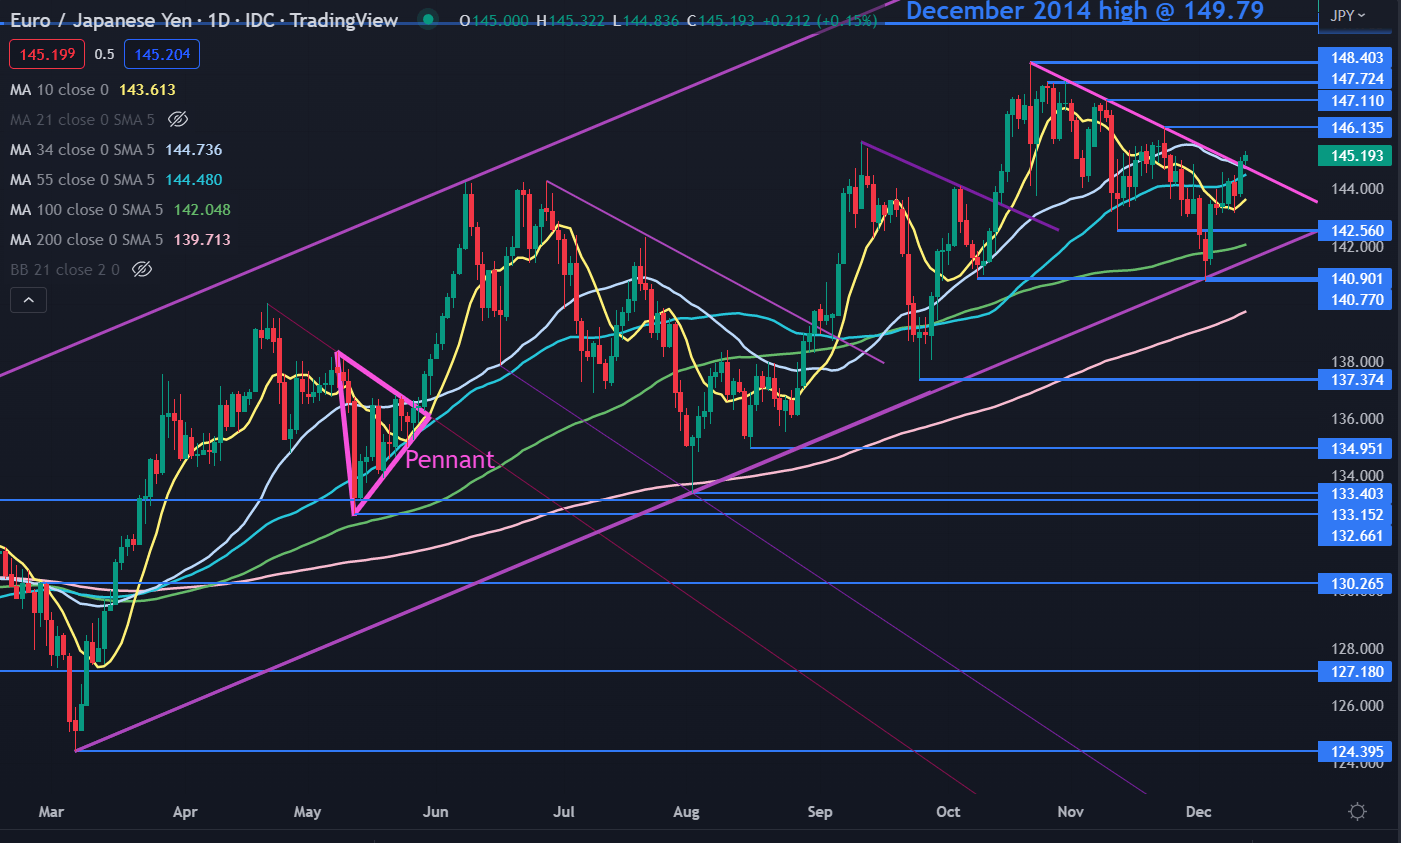
EUR/JPY has recovered from a 2-month low seen earlier this month at 140.77, which was just below a previous low at 140.90. These levels might provide support.
That move lower was also unable to penetrate an ascending trend line and it too may provide support, currently intersecting at 141.65.
Further below, support may lie at the previous lows of 137.37, 134.95 and 133.40.
The recovery to higher levels has seen EUR/JPY pop above a descending trend line. Throughout this year, such a break has sometimes seen bullish carry through. It should be noted though that past performance is not indicative of future results.
Topside resistance might be offered at the prior peaks of 146.14, 147.11, 147.72 and 148.40. Resistance could also be offered at the December 2014 peak of 149.79.
{{EDU_SUBMODULE|15}}
--- Written by Daniel McCarthy, Strategist for DailyFX.com
To contact Daniel, use the comments section below or @DanMcCathyFX on Twitter


