


Gold Weekly Technical Outlook: Neutral
- Gold prices pause at psychological support and resistance.
- XAU/USD faces a big week of event risk which could drive price action in either direction.
- USD lacks conviction after FOMC - Could Core PCE could alter the Fed’s narrative?

What’s Driving Gold Prices?
Gold futures have surrendered a portion of November gains after bulls retreated from a significant zone of technical resistance last week. As the strong recovery from the October low loses steam, a strong barrier of support and resistance continues to form around the key psychological level of $1,750.
With a formation of a dragonfly doji candle on the weekly chart suggestive of indecision, XAU/USD could be looking for a fresh catalyst to drive momentum next week.
Gold (XAU/USD) Weekly Chart
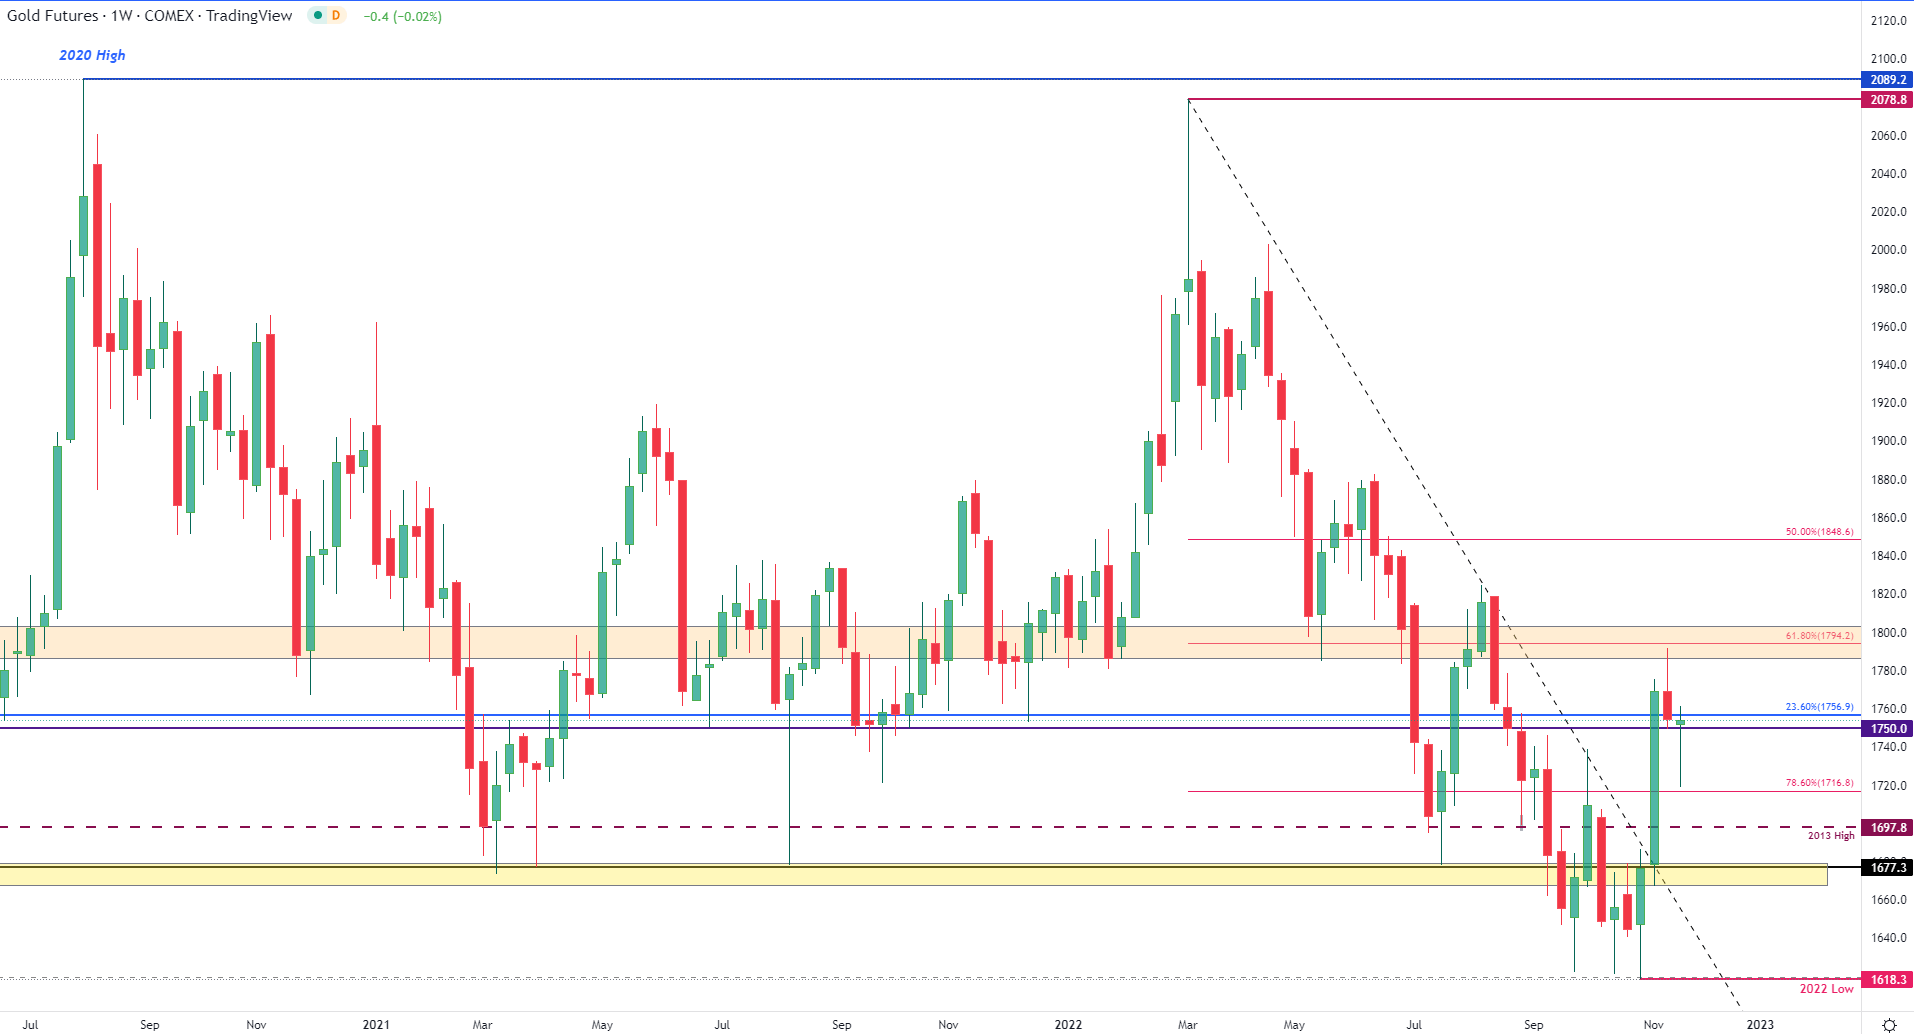
Chart prepared by Tammy Da Costa using TradingView
As investors continue to focus on monetary policy and recession risks, next week’s economic agenda could assist in driving the safe-haven assets’ next move. Although data releases next week include US GDP, ISM and employment, Wednesday’s Core PCE (personal consumption expenditure) print could pose the biggest threat to the yellow metal.
Contractionary Monetary Policy: What is it and How Does it Work?
After the recent FOMC meeting minutes raised the probability of a 50bps rate hike in December, the Federal Reserves (Fed) preferred measure of inflation could indicate whether price pressures are responding to higher interest rates.
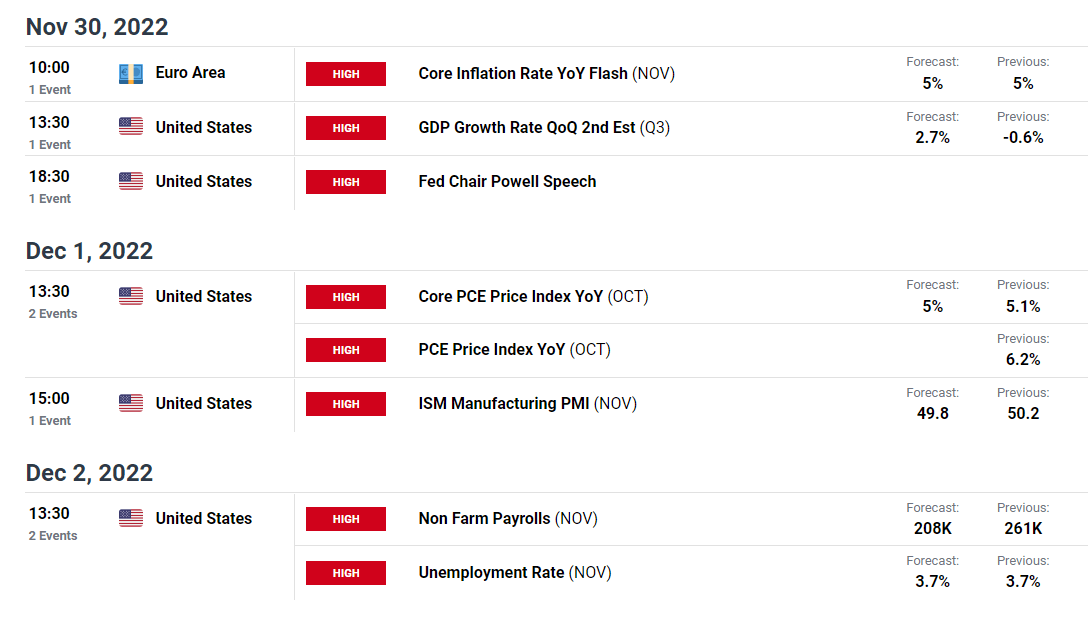
DailyFX Economic Calendar
Gold (XAU/USD) Technical Analysis
While gold futures settle around $1,750, the 23.6% Fibonacci level of the 2008 – 2020 move lies just above at $1,756.9. A move higher and a retest of the current monthly high at $1,791.8 could open the door for the 50-week MA (moving average) providing additional resistance around $1,808.
Gold (XAU/USD) Daily Chart
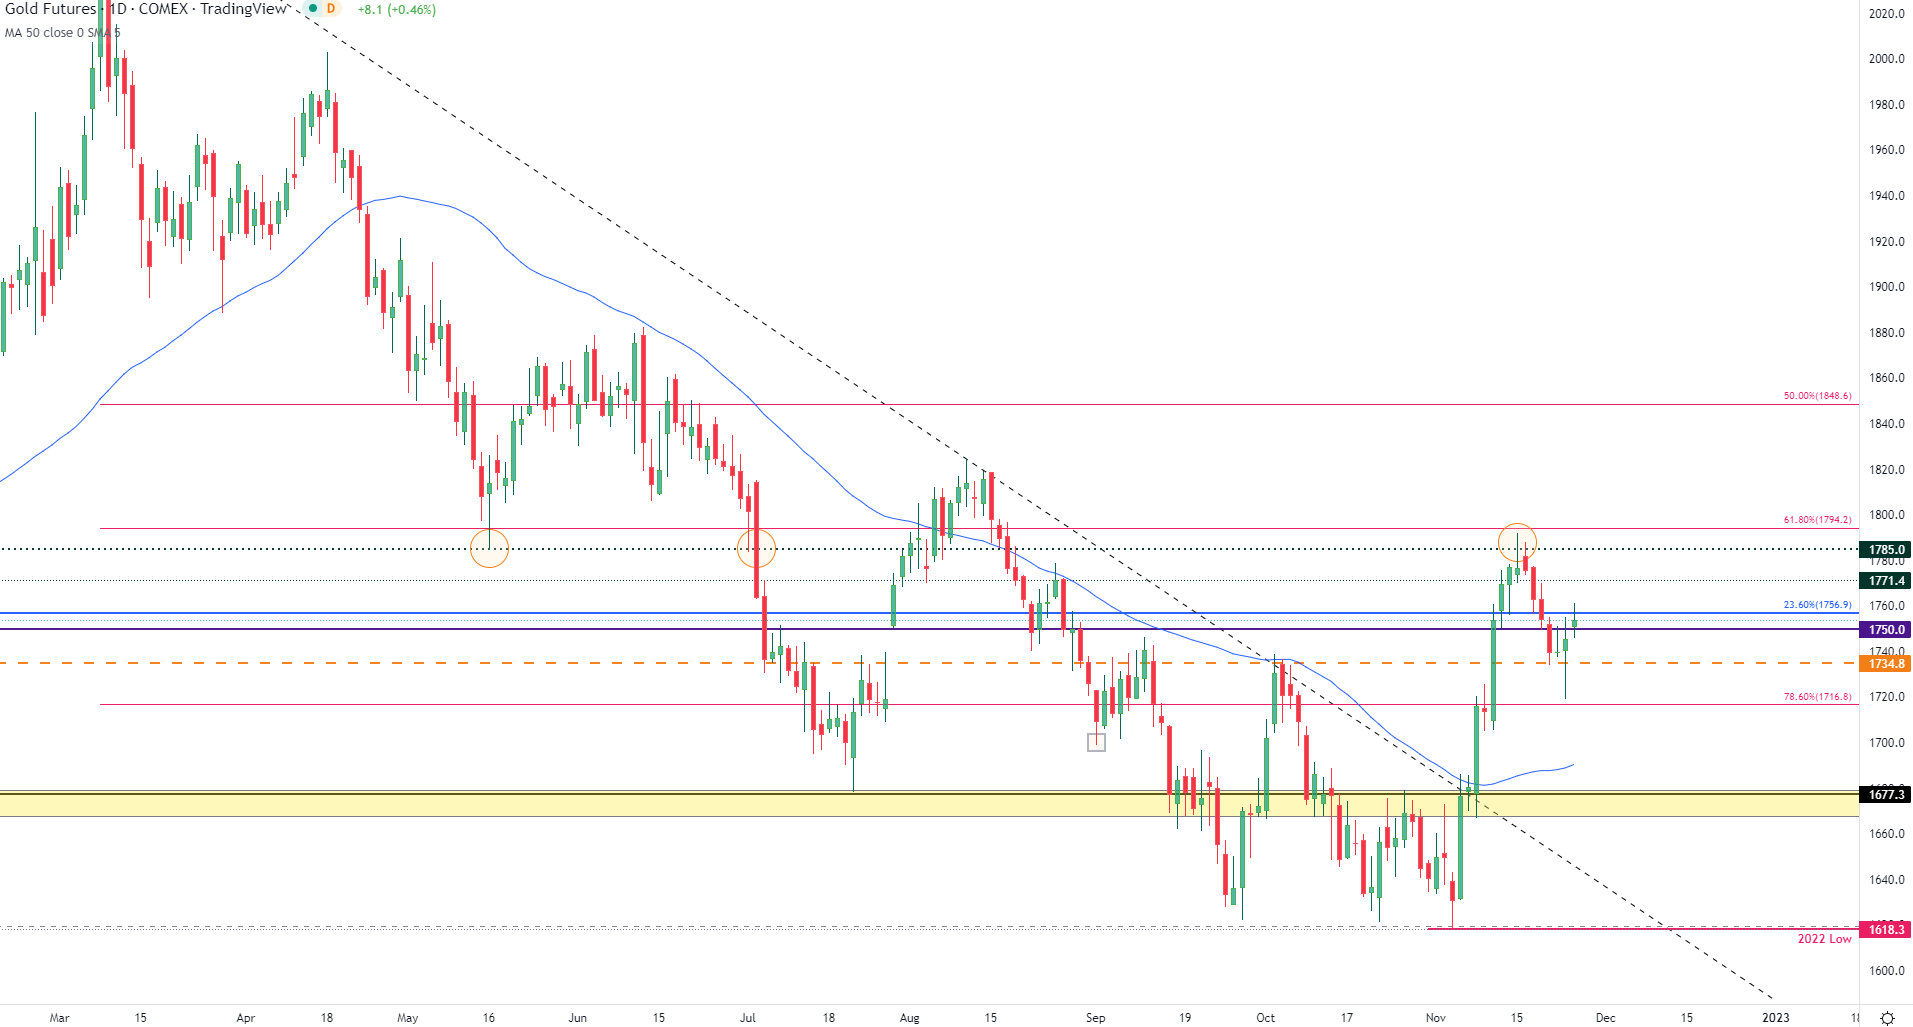
Chart prepared by Tammy Da Costa using TradingView
If gold prices fail to hold above $1,750, a move below $1,734 and a break of $1,716.8 (78.6% Fib retracement of the 2022 move) could drive XAU/USD back towards $1,700.
Introduction to Technical Analysis
Fibonacci
New to Fibonacci? We've got you covered.
--- Written by Tammy Da Costa, Analyst for DailyFX.com
Contact and follow Tammy on Twitter: @Tams707


