


Gold Technical Price Outlook: XAU/USD Short-term Trade Levels
- Gold price updated technical trade levels – Daily & Intraday Charts
- XAU/USD rally off downtrend support eyes test of downtrend resistance into October open
- New to Gold Trading? Get started with this Free How to Trade Gold -Beginners Guide
Gold prices rallied more than 0.6% since the start of the week with XAU/USD rebounding off downtrend support into the close of the month. The rally keeps price within the confines of a multi-month downtrend and the focus heading into the October / Q4 open is on a possible test of downtrend resistance for guidance. These are the updated targets and invalidation levels that matter on the XAU/USD short-term technical charts. Review my latest Strategy Webinar for an in-depth breakdown of this gold technical setup and more.
Gold Price Chart - XAU/USD Daily
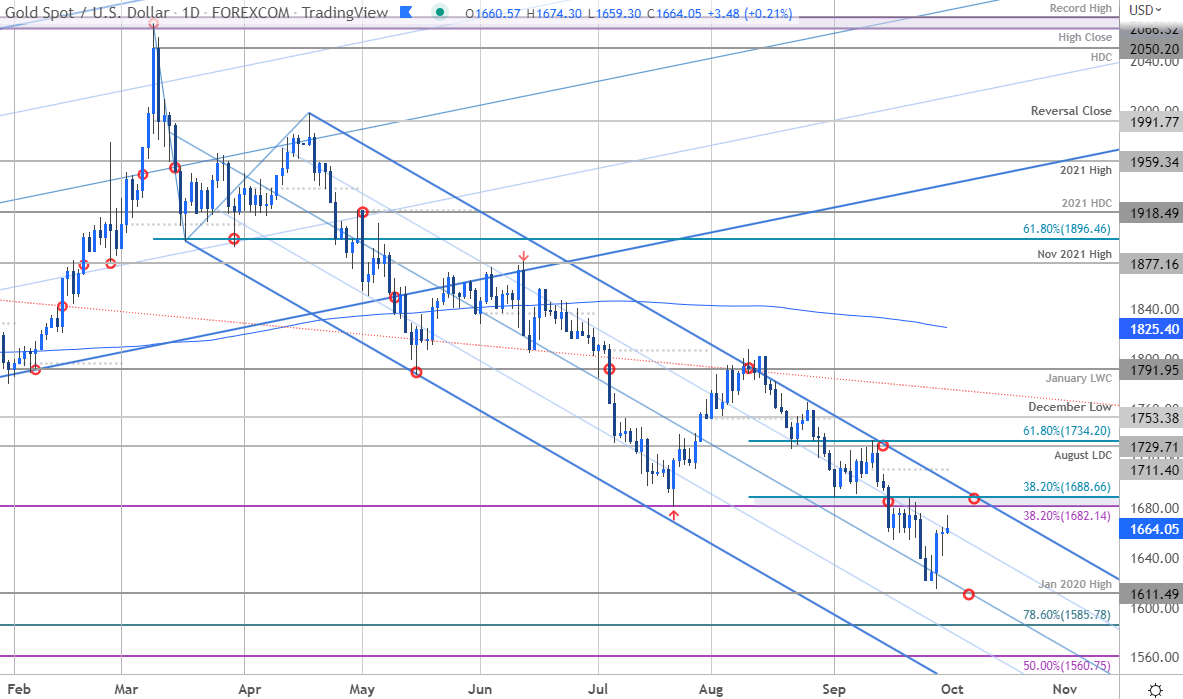
Chart Prepared by Michael Boutros, Technical Strategist; Gold on Tradingview
Technical Outlook: In last month’s Gold Short-term Price Outlook we warned that XAU/USD had turned from downtrend resistance and that, “losses sub-1729 would be technical damaging and could fuel another accelerated decline. . .” Price broke support into the close of August with gold plunging another 6.4% to fresh yearly lows – the decline turned just ahead of the January 2020 high at 1611 (low registered at 1614) this week. Looking for possible topside exhaustion on this recovery heading into October.

Gold Price Chart - XAU/USD 240min
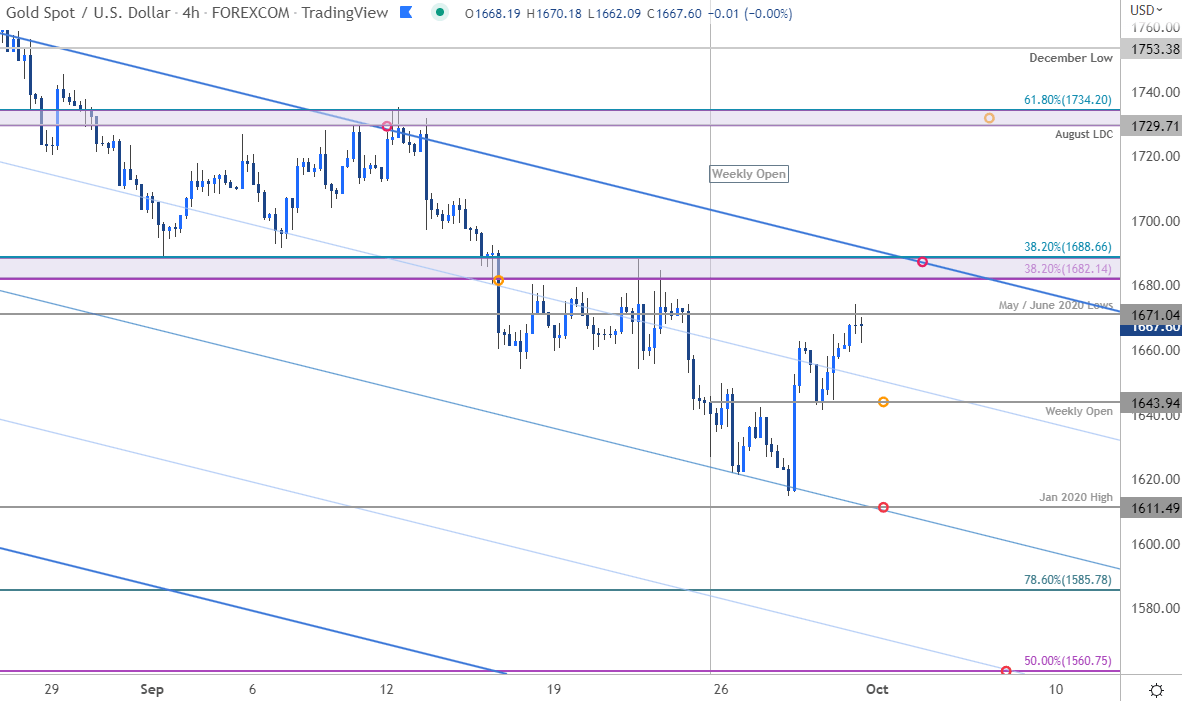
Notes: A closer look at Gold price action shows XAU/USD continuing to trade within the confines of the descending pitchfork formation we’ve been tracking off the yearly highs. A rebound off the median-line has broken through the weekly opening-range highs, threatening a possible test of the downtrend.
Initial resistance eyed at the May June 2020 lows at 1671 backed closely by the Fibonacci confluence around 1682/88- rallies should be capped by this threshold IF price is indeed heading lower on this stretch. Broader bearish invalidation now lowered to the August low-day close / 61.8% retracement at 1729/34. Weekly open support rests at 1643 backed by 1611 – a break / close below this threshold is needed to mark resumption of the broader downtrend with subsequent objectives eyed at the 78.6% retracement of the 2020 advance at 1585 and the 50% retracement of the 2015 advance at 1560.
Bottom line: Gold is rebounding off downtrend support into the close of the month and threatens a larger recovery / test of slope resistance in the days ahead. From a trading standpoint, be on the lookout for possible topside exhaustion / price inflection on a stretch towards the upper parallel (~1700) IF reached – ultimately a break / close back below 1611 is needed to mark resumption of the broader downtrend. Stay nimble heading into the monthly open with US non-farm payrolls on tap next Friday. Review my latest Gold Weekly Price Outlook for a closer look at the longer-term XAU/USD technical trading levels.
For a complete breakdown of Michael’s trading strategy, review his Foundations of Technical Analysis series on Building a Trading Strategy
Gold Trader Sentiment – XAU/USD Price Chart
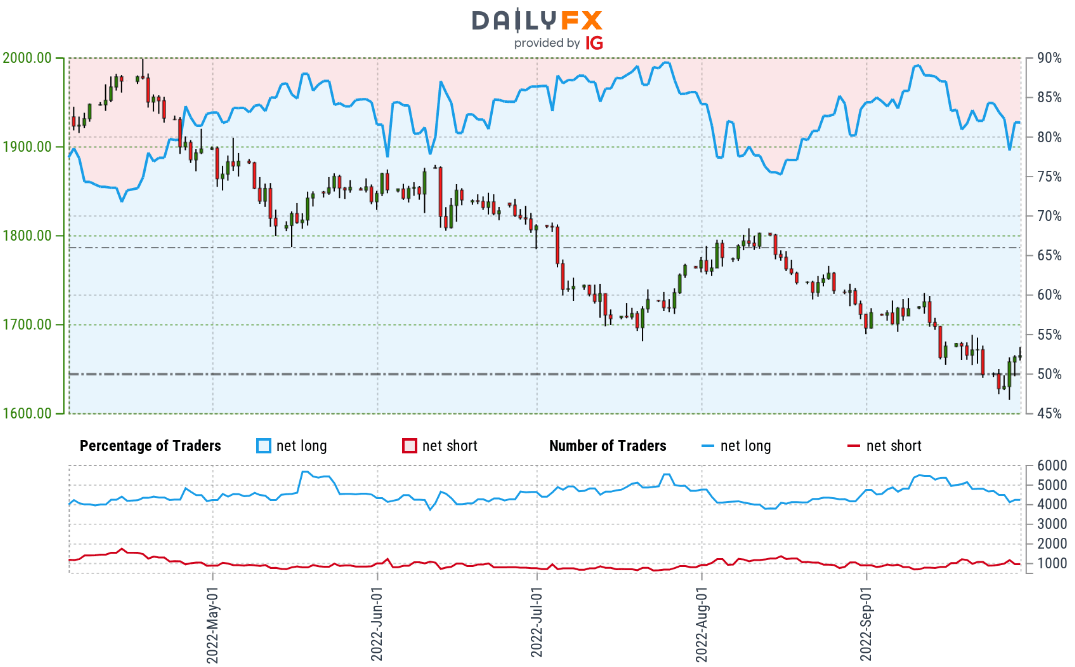
- A summary of IG Client Sentiment shows traders are net-long Gold- the ratio stands at +3.94 (79.74% of traders are long) – typically bearish reading
- Long positions are 0.94% lower than yesterday and 12.71% lower from last week
- Short positions are 7.18% higher than yesterday and 12.21% higher from last week
- We typically take a contrarian view to crowd sentiment, and the fact traders are net-long suggests Gold prices may continue to fall. Yet traders are less net-long than yesterday and compared with last week. From a sentiment standpoint, the recent changes in positioning warn that the current Gold price trend may soon reverse higher despite the fact traders remain net-long.
| Change in | Longs | Shorts | OI |
| Daily | 1% | -3% | -1% |
| Weekly | 2% | -8% | -2% |
Economic Calendar
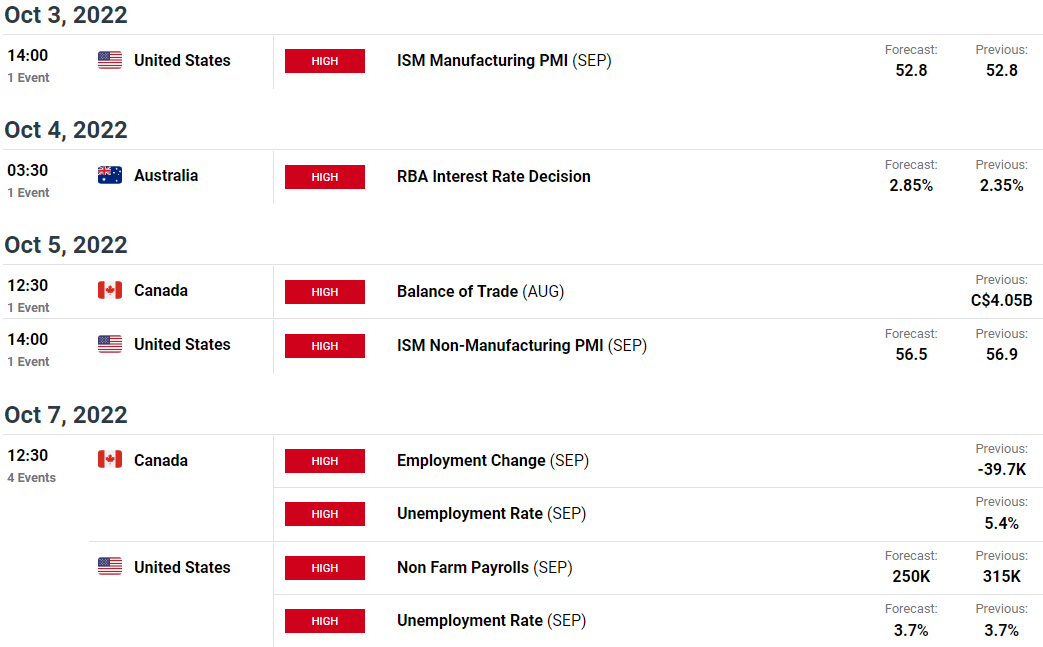
Economic Calendar - latest economic developments and upcoming event risk.
Active Technical Setups
- Written by Michael Boutros, Technical Strategist with DailyFX
Follow Michael on Twitter @MBForex


