


XAU/USD and XAG/USD Talking Points:
- XAU/USD Technical Outlook: Neutral.
- XAG/USD Technical Outlook: Bullish.
- XAU/USD Breaks Out of Falling Wedge Pattern and Prints Double-Bottom. How Far Can the Rally Go?
- XAG/USD Weekly Bullish Inside Bar Candle Hints at Further Upside.

Gold looked on course for a second week of losses before a late rally on Friday saw the precious metal look set to post a doji candle close on the weekly timeframe. The continued hawkish rhetoric from Federal Reserve speakers coupled with Fed Funds peak rate now seen at 5% in comparison to 4,75% a week ago have added to the dollar’s rise as the resurgent dollar and rising yields continued to halt upside rallies. The precious metal is down more than 20% since its March high. Given inflation is still rampant and more rate hikes lie ahead there is every chance that a new YTD low could be in store for the precious metal as well as silver.
XAU/USD Technical Outlook
XAU/USD D Chart
Source: TradingView, prepared by Zain Vawda
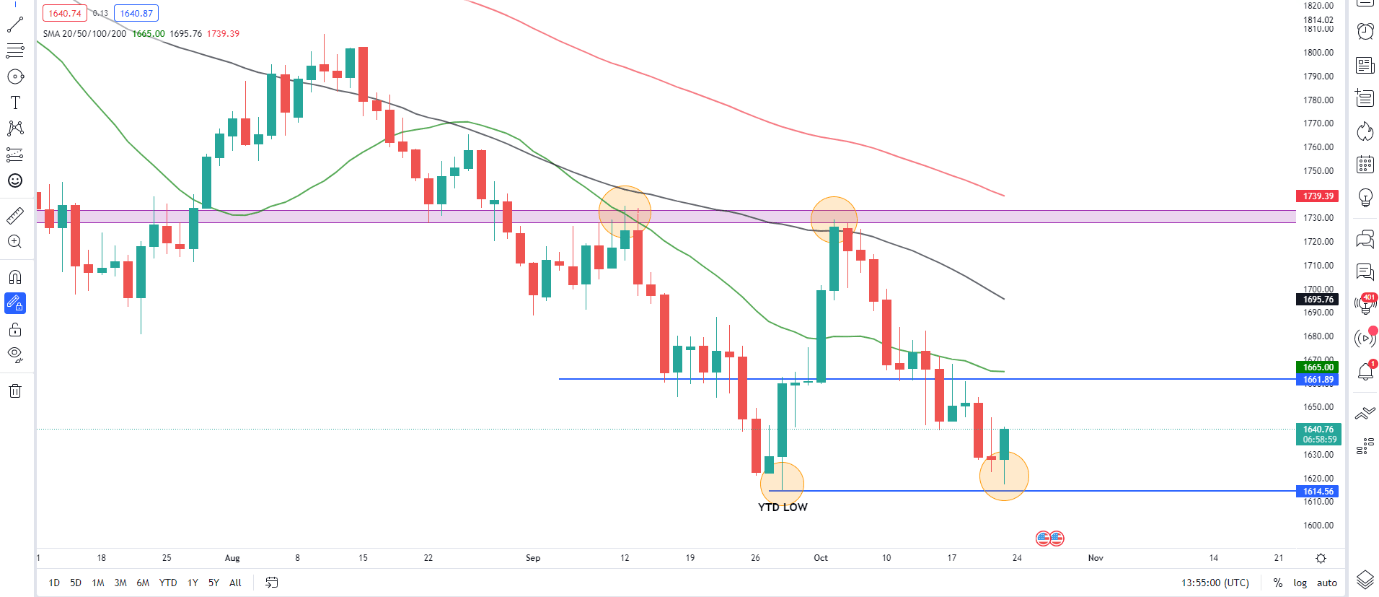
Looking at the bigger picture, the overall downtrend on gold remains intact. Since price formed a double-top pattern on October 4 around the $1730 price level there has been an aggressive decline toward the YTD low around $1614. On Friday price tapped $1617, coming within a whisker of the YTD low before an aggressive bounce saw price rally $20 to the upside.
On the daily chart above the MA’s are some distance away from current price. A bullish daily candle close coupled with a weak dollar in the early part of the week could see price retest the 20-SMA while a break higher could see price rally toward the 50-SMA which rests around the $1685-$1690 area. Price seems to have printed a double bottom formation as well which could lead to a sustained upside rally next week before the Fed meet on November 2nd.
XAU/USD Four-Hour Chart
Source: TradingView, prepared by Zain Vawda
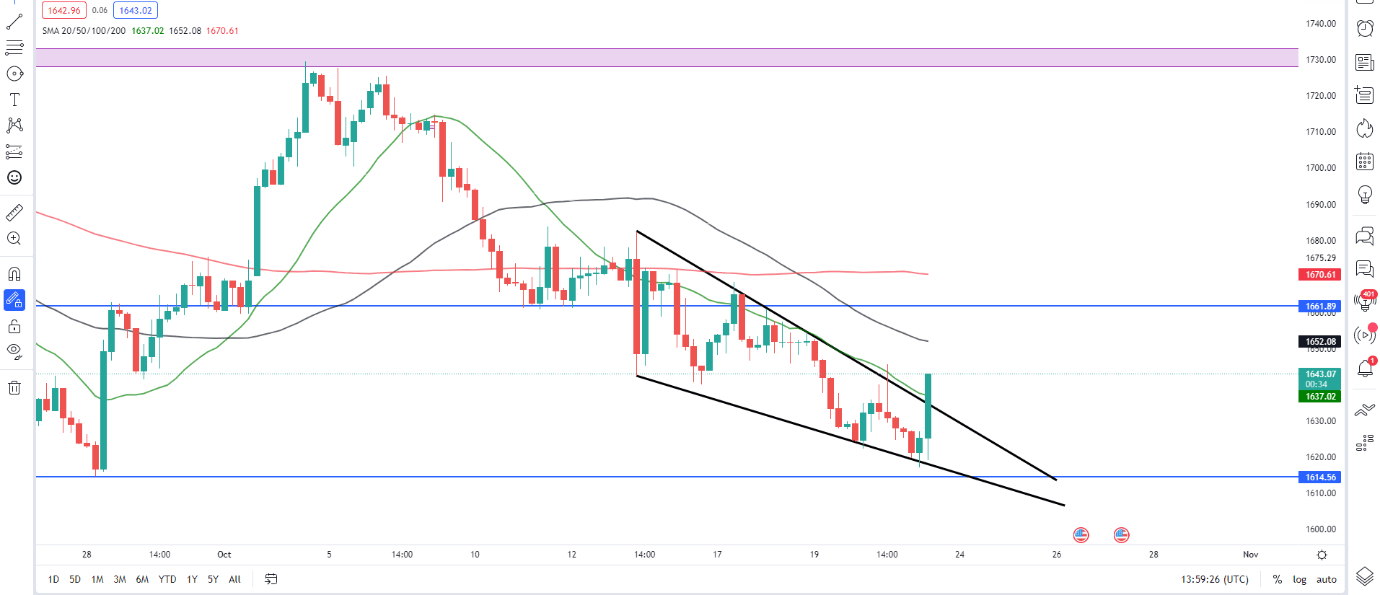
The 4H chart provides further credence to a potential rally in the early part of the week as we have broken out of the falling wedge pattern. A rally toward the 100-SMA which lines up with the $1675 area on the 4H chart may be a possibility.
Trading the Falling Wedge Pattern
XAG/USD Technical Outlook
XAG/USD Daily Chart
Source: TradingView, prepared by Zain Vawda
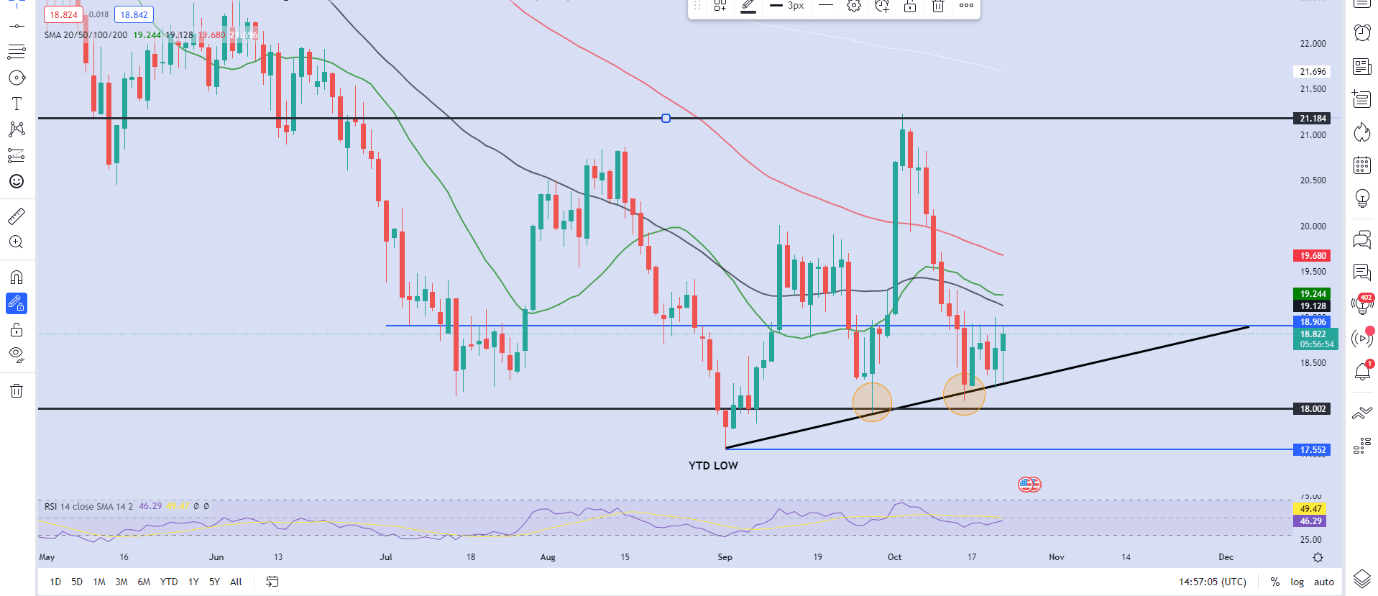
From a technical perspective, the weekly candlestick looks set to close as a bullish inside bar which would hint at a push higher next week. The daily chart seems to support further upside as well, as price has formed a double-bottom pattern. However there remains a lot of technical hurdles for silver to clear just above current price which may cap any potential gains moving forward. We have resistance around the $19 level while we also have the 20, 50 and 100-SMA resting between the $19-$20 price area. Given the confluence prevalent at these levels, a sustained break above the $20 area is needed if price is to push higher.
Alternatively, a break back below the ascending trendline and the $18.00 psychological level may open up a retest of the YTD low. Should this occur there is every chance price may print a new YTD low.
| Change in | Longs | Shorts | OI |
| Daily | 1% | -3% | -1% |
| Weekly | 2% | -8% | -2% |
Resources For Traders
Whether you are a new or experienced trader, we have several resources available to help you; indicators for tracking trader sentiment, quarterly trading forecasts, analytical and educational webinars held daily, trading guides to help you improve trading performance, and one specifically for those who are new to forex.
--- Written by Zain Vawda for DailyFX.com
Contact and follow Zain on Twitter: @zvawda


