


Gold, XAU/USD, Crude Oil, WTI – Commodities Technical Analysis:
- Gold and crude oil prices maintain a near-term upside technical bias
- But, WTI and XAU/USD appear to be showing signs of exhaustion
- What are key levels to watch in the event that a turn lower emerges?

Gold Technical Analysis
Gold prices continue trading upwards within the boundaries of a Rising Wedge chart formation. This is typically a bearish pattern that can open the door to resuming the previous downtrend. In this case, that would be the path lower gold took from March through November. But, while XAU/USD continues to trade within the boundaries of the wedge, the near-term trajectory may remain tilted slightly upward.
Immediate resistance appears to be the 78.6 percent Fibonacci retracement level at 1822. Clearing higher opens the door to face the ceiling of the wedge. Keep a close eye on RSI. Negative divergence continues to show that upside momentum is fading.
A breakout under the wedge might offer an increasing downside technical bias. That would place the focus on the 50-day Simple Moving Average (SMA). The latter may reinstate the near-term upside bias. Otherwise, the 1725 – 1735 inflection zone sits below that.
XAU/USD Daily Chart
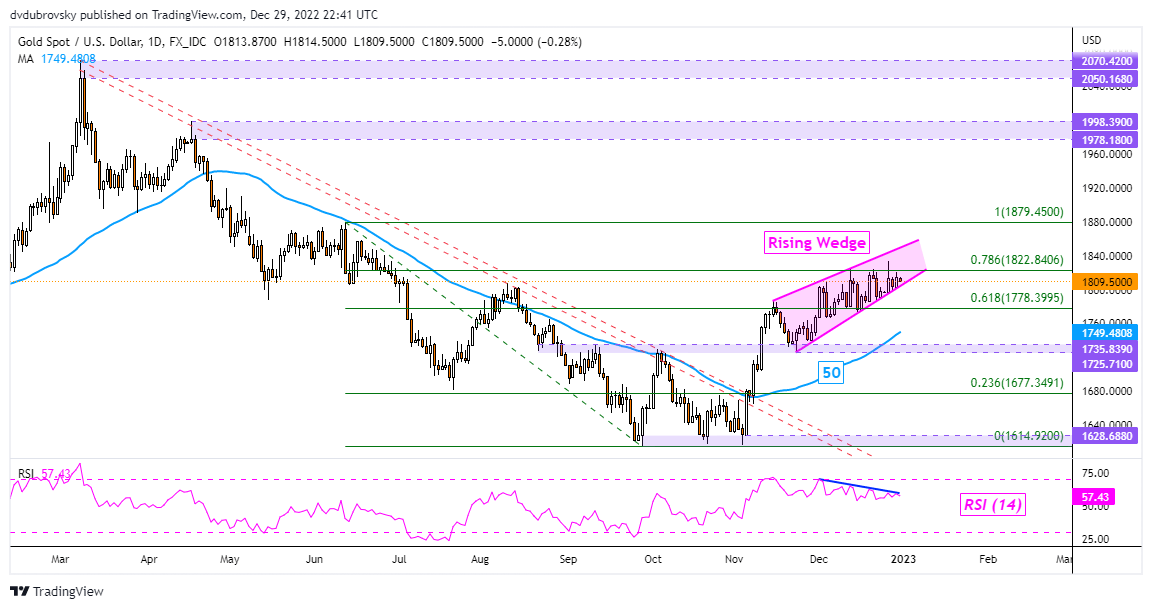
Chart Created in TradingView
Crude Oil Technical Analysis
Unlike gold, crude oil prices have confirmed an upside breakout through the ceiling of a bullish Falling Wedge chart formation. That has opened the door to an upside technical bias that could reverse the near-term downtrend from November through the middle of December. However, there are a couple of cues that upside momentum is struggling.
The first is that oil was unable to clear the 50-day SMA, which maintained a downward bias. As prices tested the former, a Shooting Star candlestick pattern formed. The latter is typically a sign of indecision that becomes more bearish if prices follow lower after the star’s formation. This has been the case.
Immediate support appears to be the 23.6% Fibonacci retracement level. Closing lower exposes the 71.13 – 70.10 support zone. In the event prices push above the 50-day SMA, key resistance afterward appears to be the 61.8% retracement level at 84.703.

WTI Daily Chart
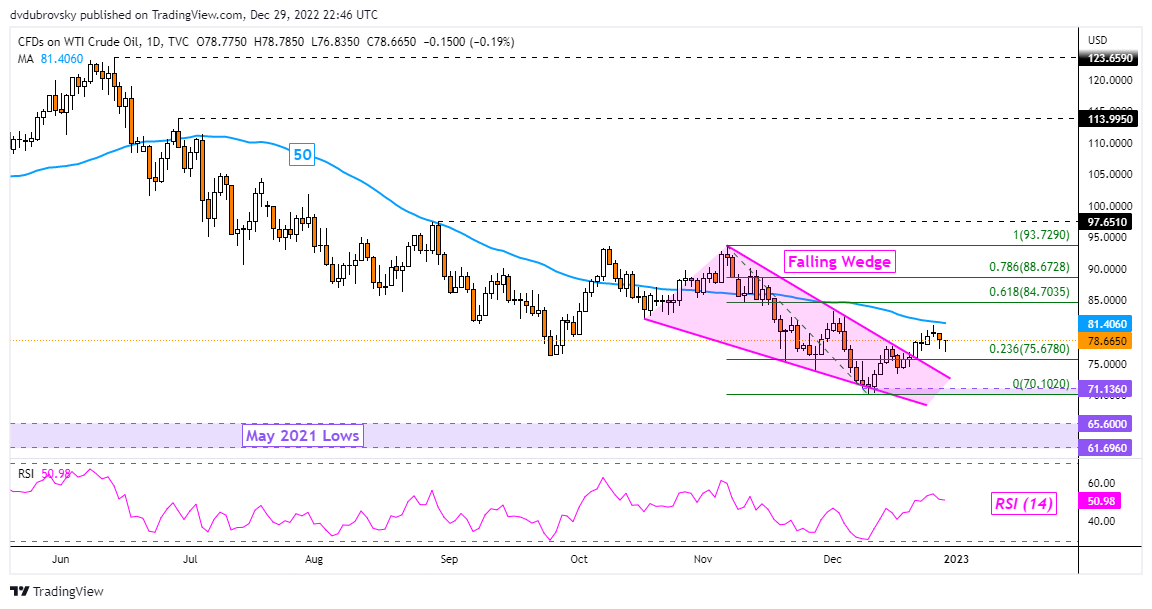
Chart Created in TradingView
--- Written by Daniel Dubrovsky, Senior Strategist for DailyFX.com
To contact Daniel, follow him on Twitter:@ddubrovskyFX


