FTSE 100, DAX 40, Nasdaq 100 Daily Prices, Analysis and Charts
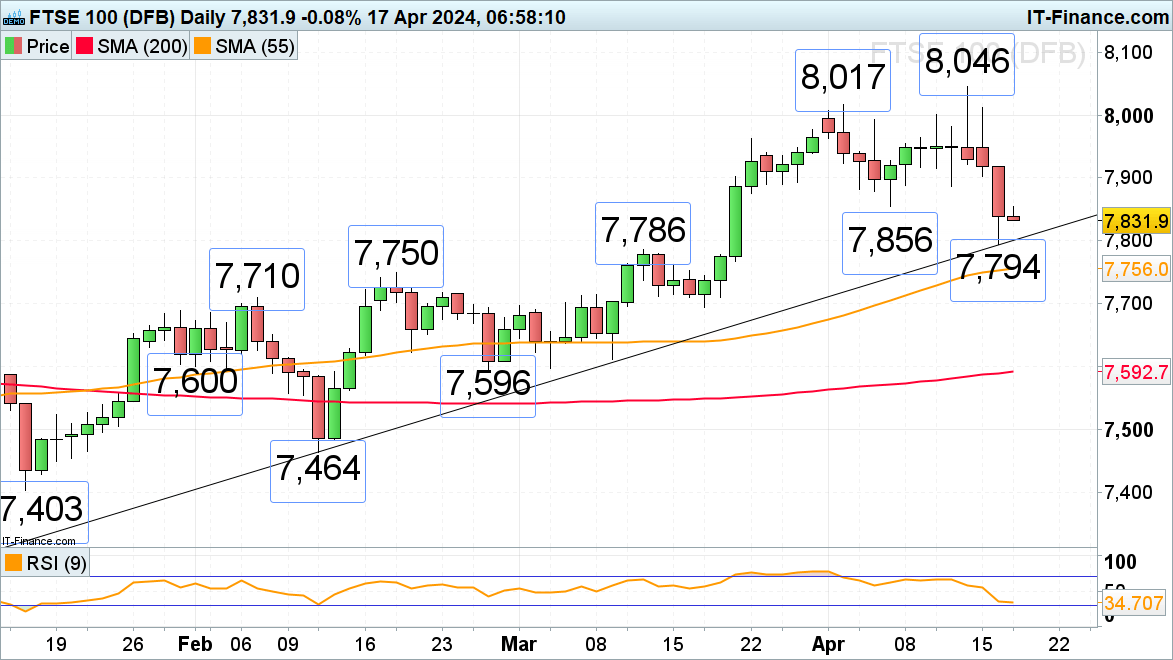
FTSE 100 on track for fourth day of losses
The FTSE 100 remains under pressure due to heightened tensions in the Middle East and weighs on its February-to-April uptrend line at 7,802. A fall through it and Monday’s 7,794 low would have the 7,786 mid-March high in its sights. Further potential support can be spotted between the 7,750 to 7,710 February highs.
Minor resistance sits at the early April 7,856 low.
FTSE 100 Daily Chart
Download our complimentary Q2 Equity Forecasts below:

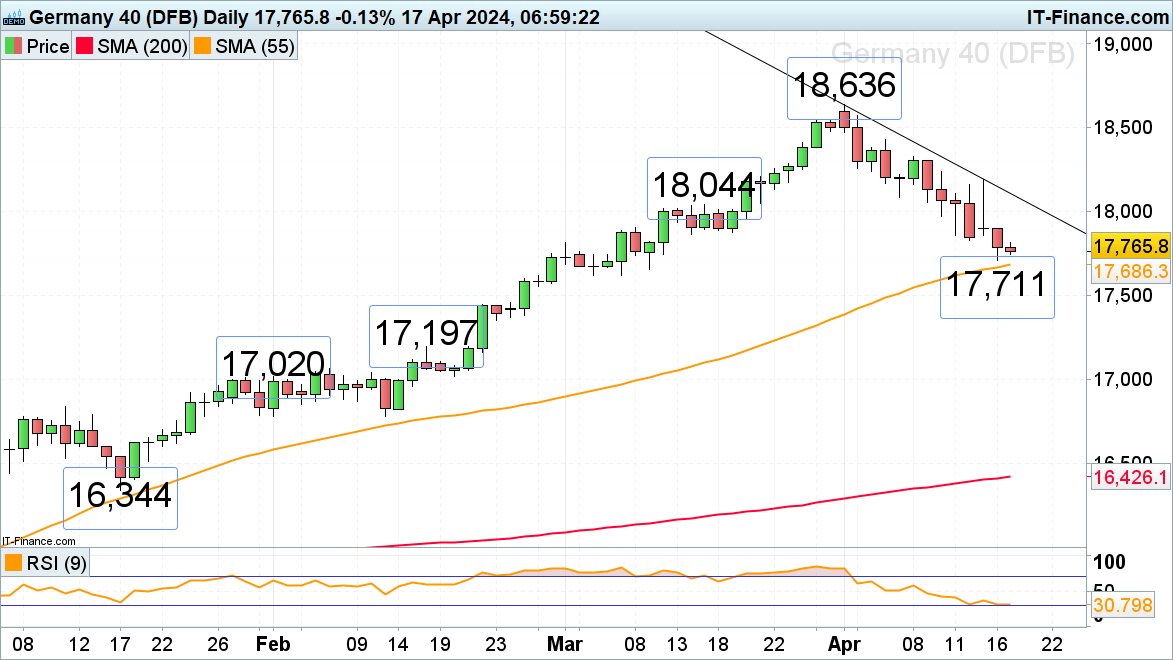
DAX 40 on track for seventh day of losses
The DAX 40 slid to a five-week low at 17,711 on Tuesday amid the Iran/Israel conflict, close to the 55-day simple moving average (SMA) at 17,686 which may offer support. If not, the 7 March low at 17,619 may do so. Minor resistance can be found at Friday’s 17,831 low.
For the bulls to even short-term be in control a bullish reversal and rise above Tuesday’s high at 17,903 needs to be seen.
DAX 40 Daily Chart
See how Client Sentiment can help you make a more informed trading decision
| Change in | Longs | Shorts | OI |
| Daily | 19% | 0% | 4% |
| Weekly | 0% | 6% | 5% |
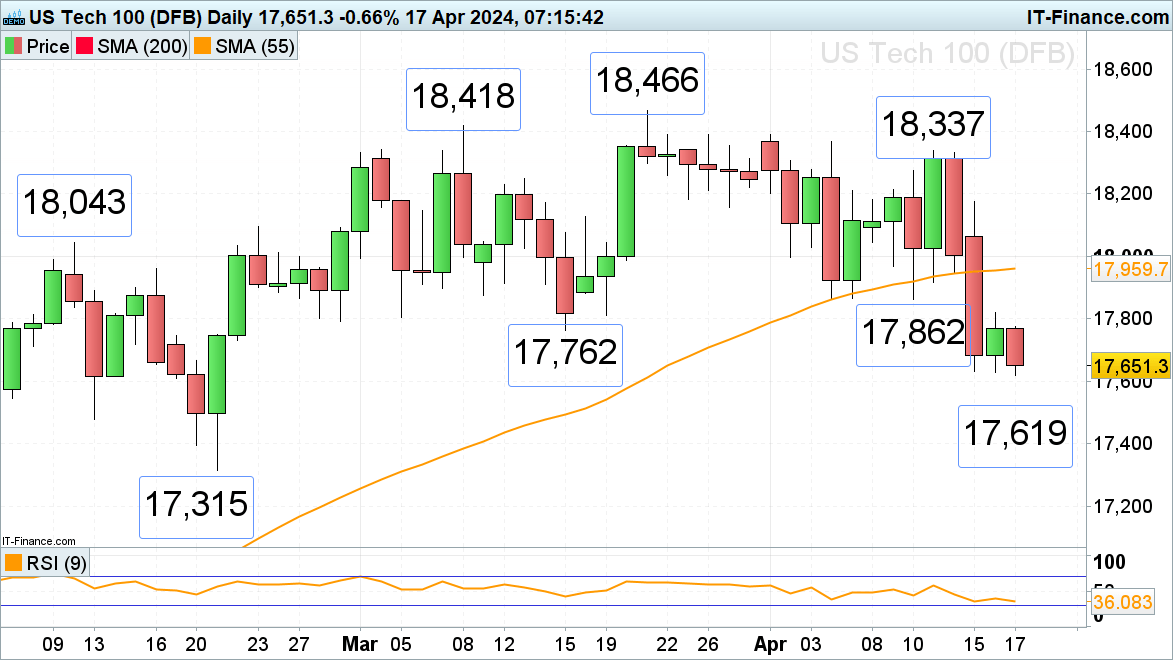
Nasdaq 100 trades at near two-month lows
The Nasdaq 100’s sharp fall to 17,630 on Monday, despite a minor bounce on Tuesday, is being followed by a slip toward the 17,600 area amid comments by Fed Chair Jerome Powell that rates need to stay higher for longer as US inflation remains sticky. Another possible downside target is the 17,477 mid-February low.
Resistance sits in the 17,762 to 17,790 area which consists of the late February and mid-March lows.
Nasdaq 100 Daily Chart