


USD, Indices Talking Points:
- Today brought another 75 bp rate hike from the FOMC. The initial reaction was equity positive and USD negative but that reversed during Chair Powell’s press conference.
- The focus now shifts to Friday’s NFP report and given the fact that we just got through FOMC, Fed-speak becomes another driver of note that will push prices across markets. This can work on both sides of the equation.
- The analysis contained in article relies on price action and chart formations. To learn more about price action or chart patterns, check out our DailyFX Education section.

It was another 75 basis point hike out of the Fed and given some slight changes in the statement, speaking to ‘cumulative’ rate hikes and the lag of policy transmission, the initial reaction was risk-positive. Some market participants read that moderation to mean that the Fed may take a heavier hand in stating that they’ll be looking at slower rate hikes.
This pushed all the way through the first ten minutes of the press conference, until Chair Powell came right out to say ‘it’s premature to talk about pausing,’ which was followed up by a plethora of slightly-hawkish comments that dismissed the idea that the bank may be nearing any possible policy pivots.
In short-order, USD strength came roaring back and stocks began to turn. The gains that built after the statements release were quickly erased, and all three US equity indices are now lower on the day. I had looked into equities earlier in the day and I’ll update those setups here, while also taking a deeper look at the US Dollar later in the article.
S&P 500
The S&P 500 has now broken below support of a rising wedge formation, which is often tracked with the aim of bearish reversals. The immediate support was 3802-3820 and that’s now being traded through as well, with price moving all the way down to next support at a short-term spot around 3777.
My next key spot of support is 3750, and that 3802-3820 zone now becomes resistance potential.
S&P 500 Four-Hour Chart
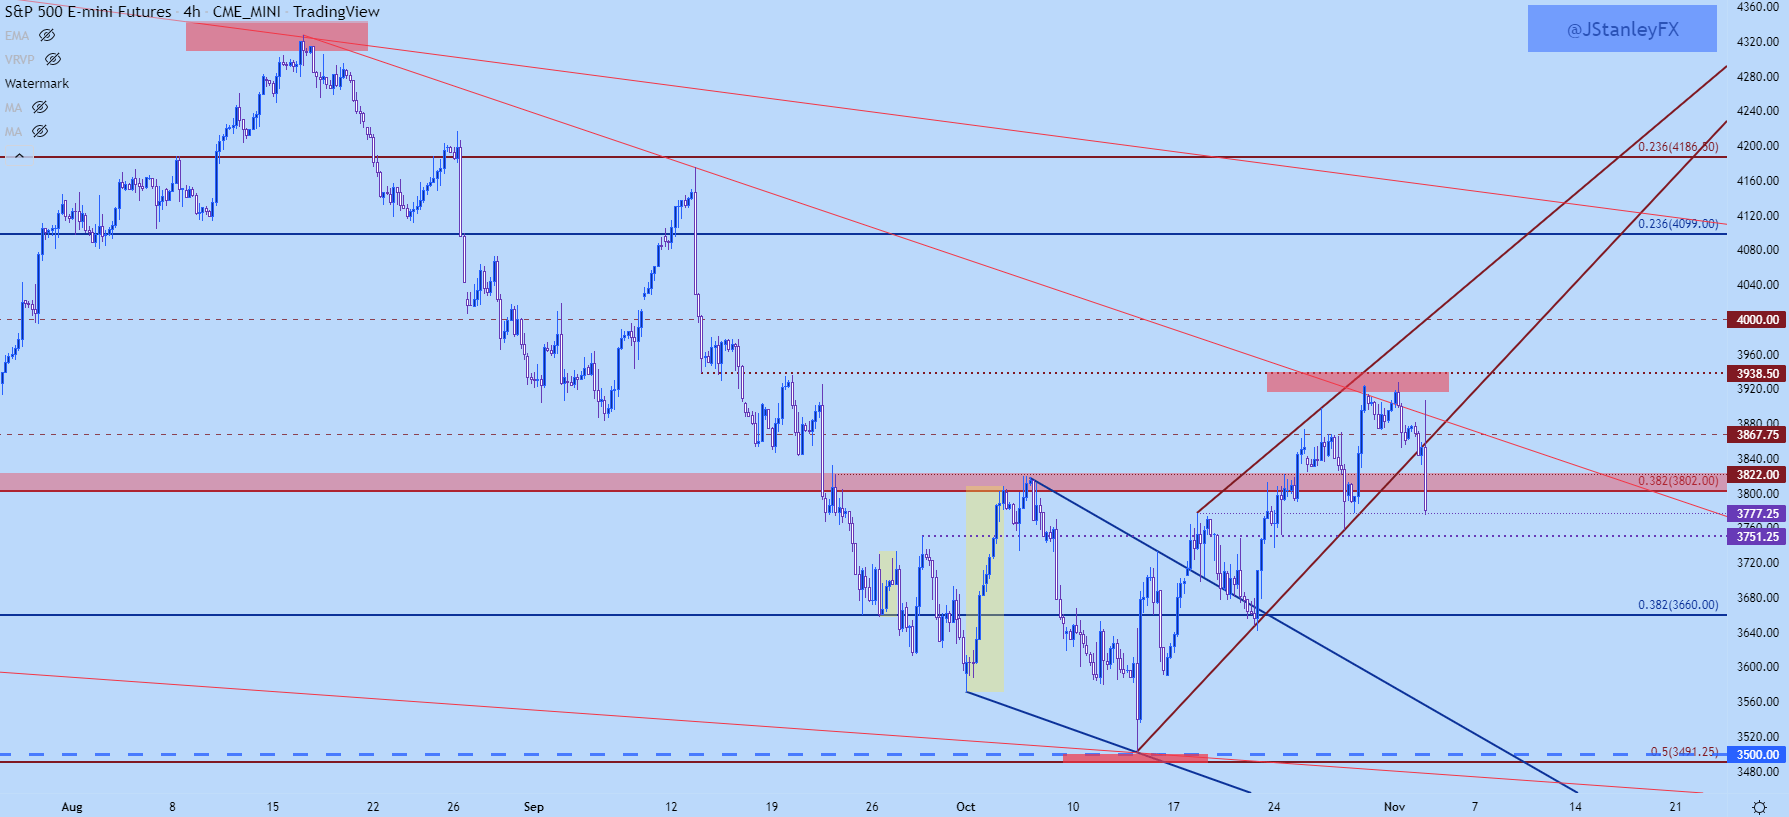
Chart prepared by James Stanley; S&P 500 on Tradingview
Nasdaq
As I had highlighted this morning, the Nasdaq was the weakest of the three major US indices and given how interest rate sensitive the tech-heavy index is, this more-hawkish focus from the Fed makes the Nasdaq a bit more vulnerable.
The Nasdaq is already trading through the 11k psychological level that had helped to set support a number of times when prices were grinding in that area in late-October. My next spot of support is at 10,890 and below that, 10,767. If/when sellers can take that our or test that level, the current low is at 10,501, which is a long-term Fibonacci level that was my first target for the Top Trade for Q4.
Nasdaq 100 Four-Hour Price Chart
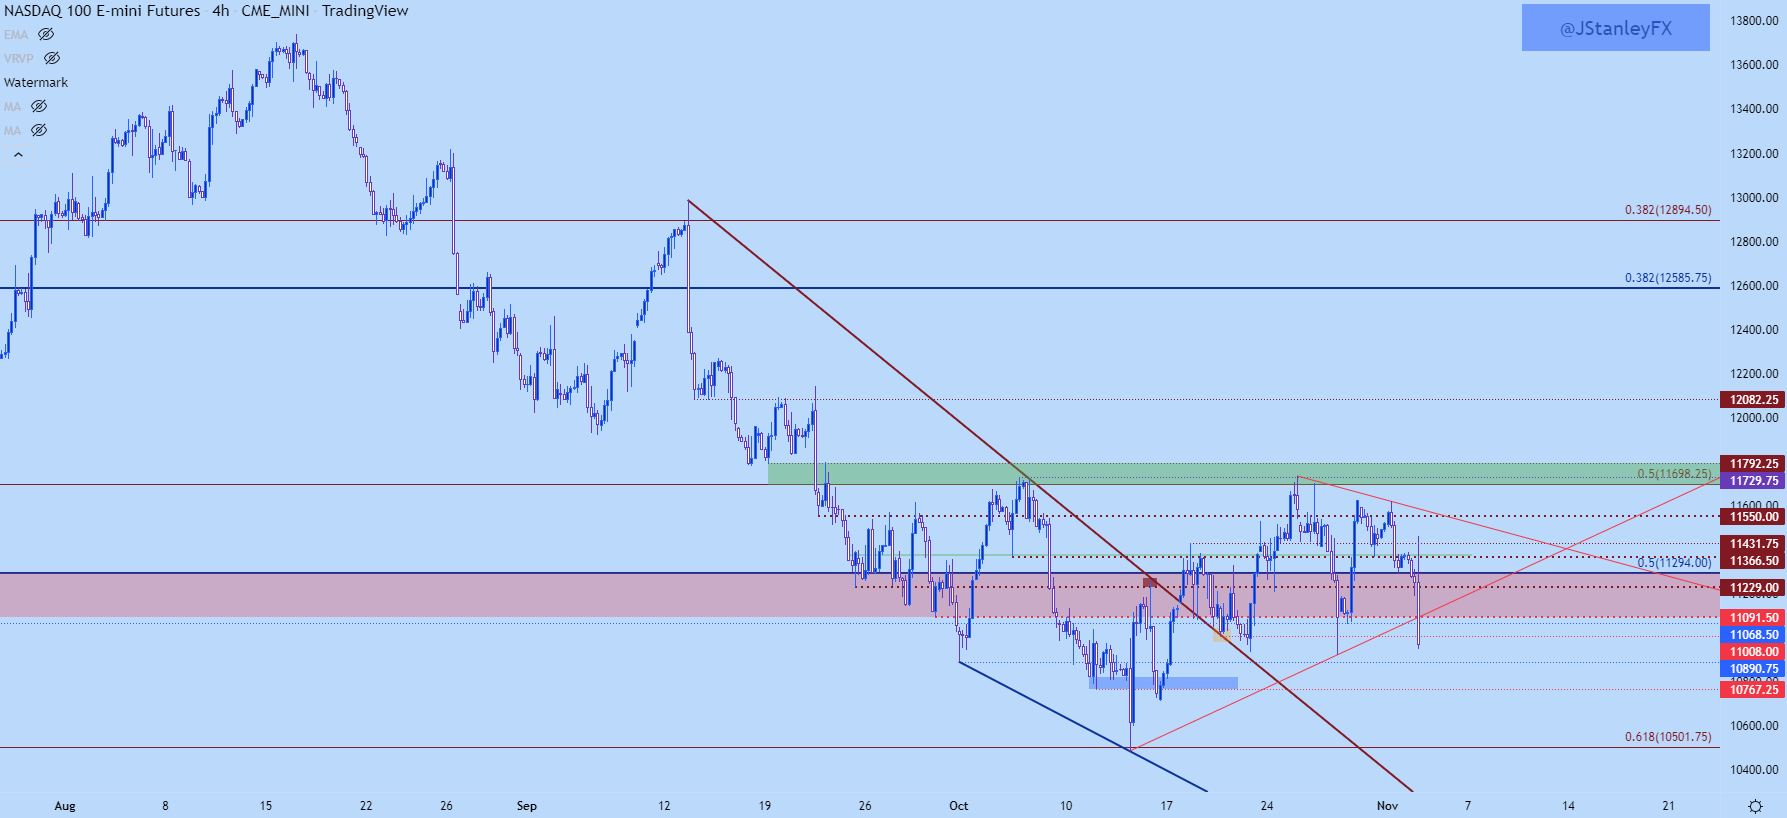
Chart prepared by James Stanley; Nasdaq 100 on Tradingview
Nasdaq Shorter-Term
At this point, there’s a few spots of prior support that now become resistance potential for the Nasdaq. The 11,068-11,091 zone sticks out, and above that 11,229 has had a number of inflections, including during the press conference, and this remains relevant, as well.
Nasdaq 100 Two-Hour Price Chart
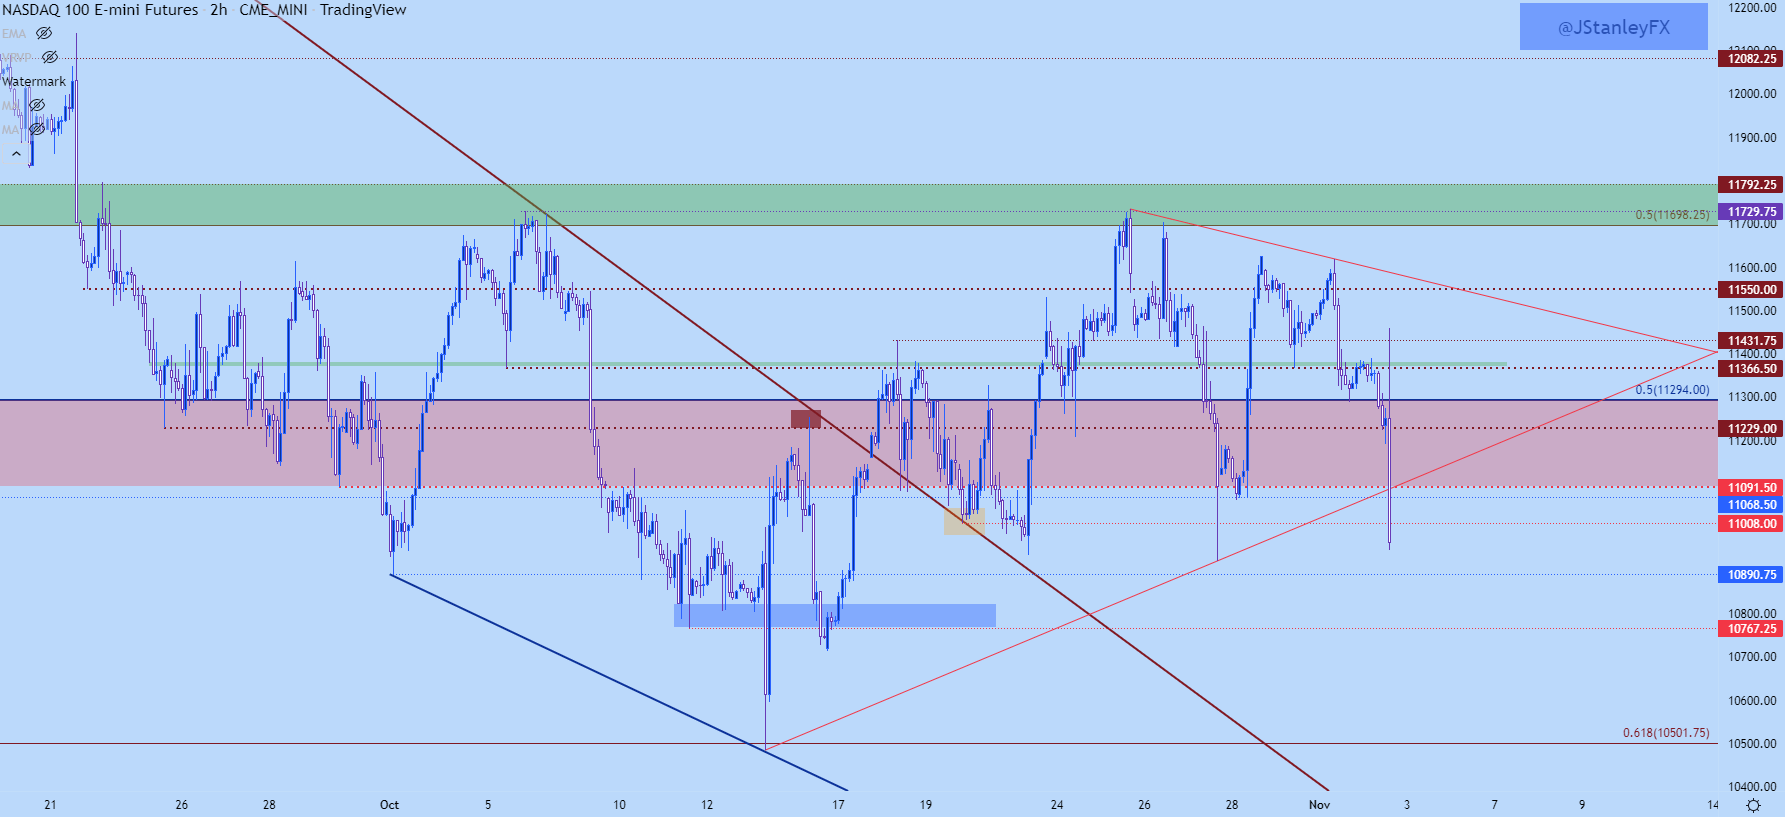
Chart prepared by James Stanley; Nasdaq 100 on Tradingview
USD
The US Dollar was looking somewhat beleaguered in the early-portion of today’s rate decision. The DXY had quickly pushed back-up to a key spot of resistance yesterday, the same that had set the neckline for the double top formation last week.
After the statement was released, the DXY snapped back; but it was just above six minutes into the press conference that a low was set and the USD began to climb. That move has since continued and the US Dollar is now sitting at a fresh weekly high.

US Dollar Two-Hour Price Chart
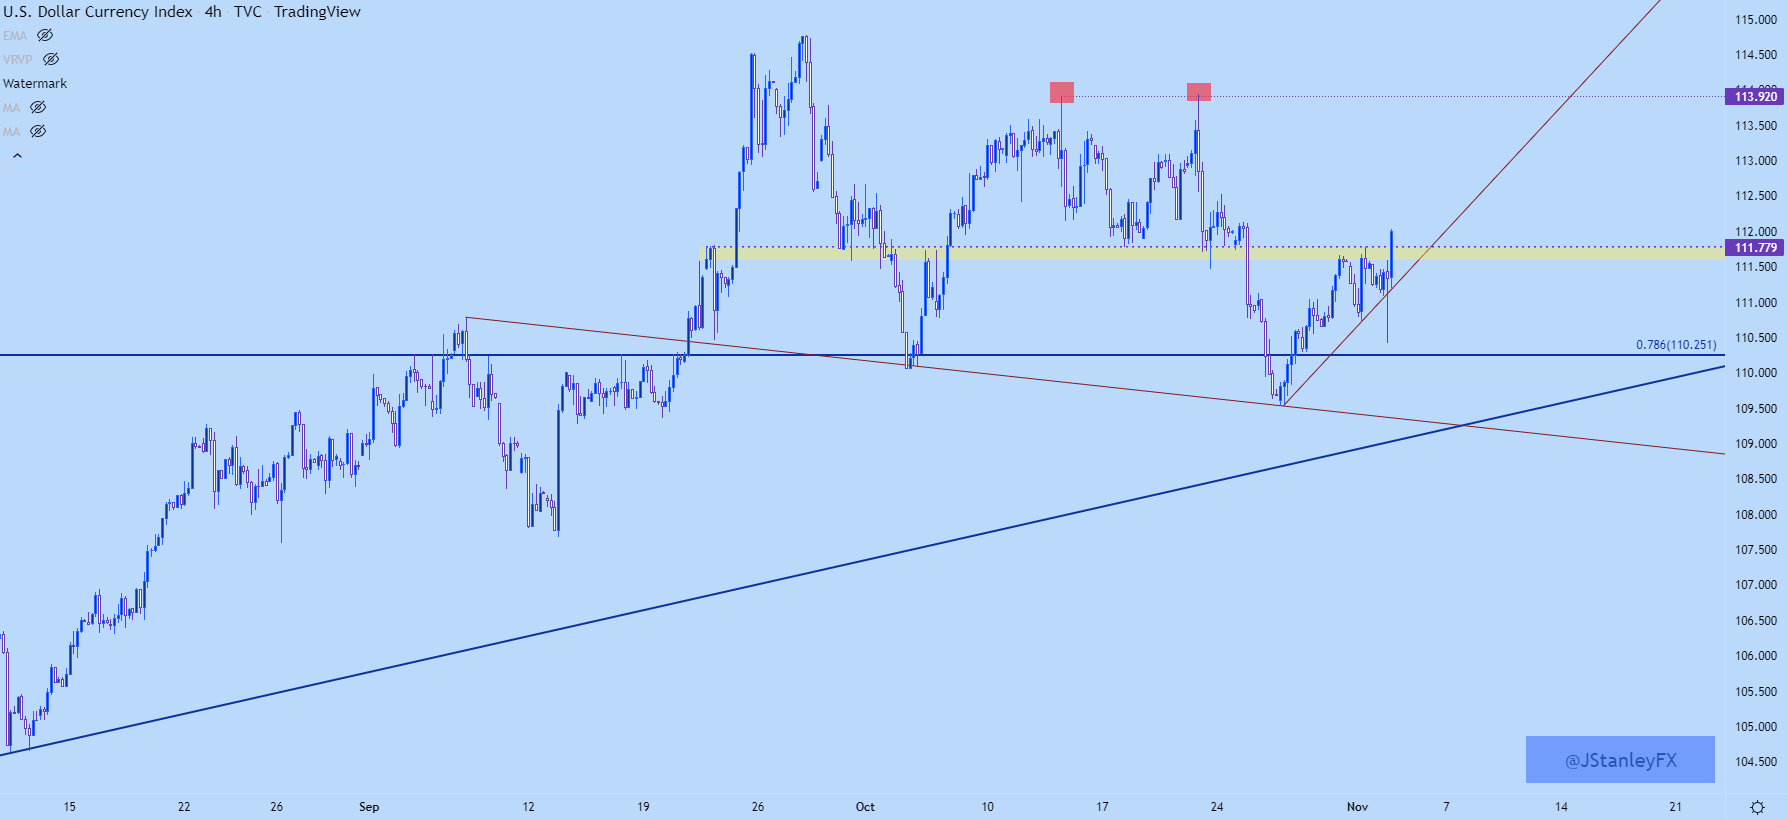
Chart prepared by James Stanley; USD, DXY on Tradingview
USD Longer-Term
If we’re going to see a re-test of the highs in USD, we’re likely going to need a more aggressive bearish movement in EUR/USD. The Euro is 57.6% of DXY and the big point of resistance sitting overhead is the 113.92 level that set the double top. Along the way, there’s a point of shorter-term resistance sitting overhead at 112.56 that remains of note.
US Dollar Daily Chart
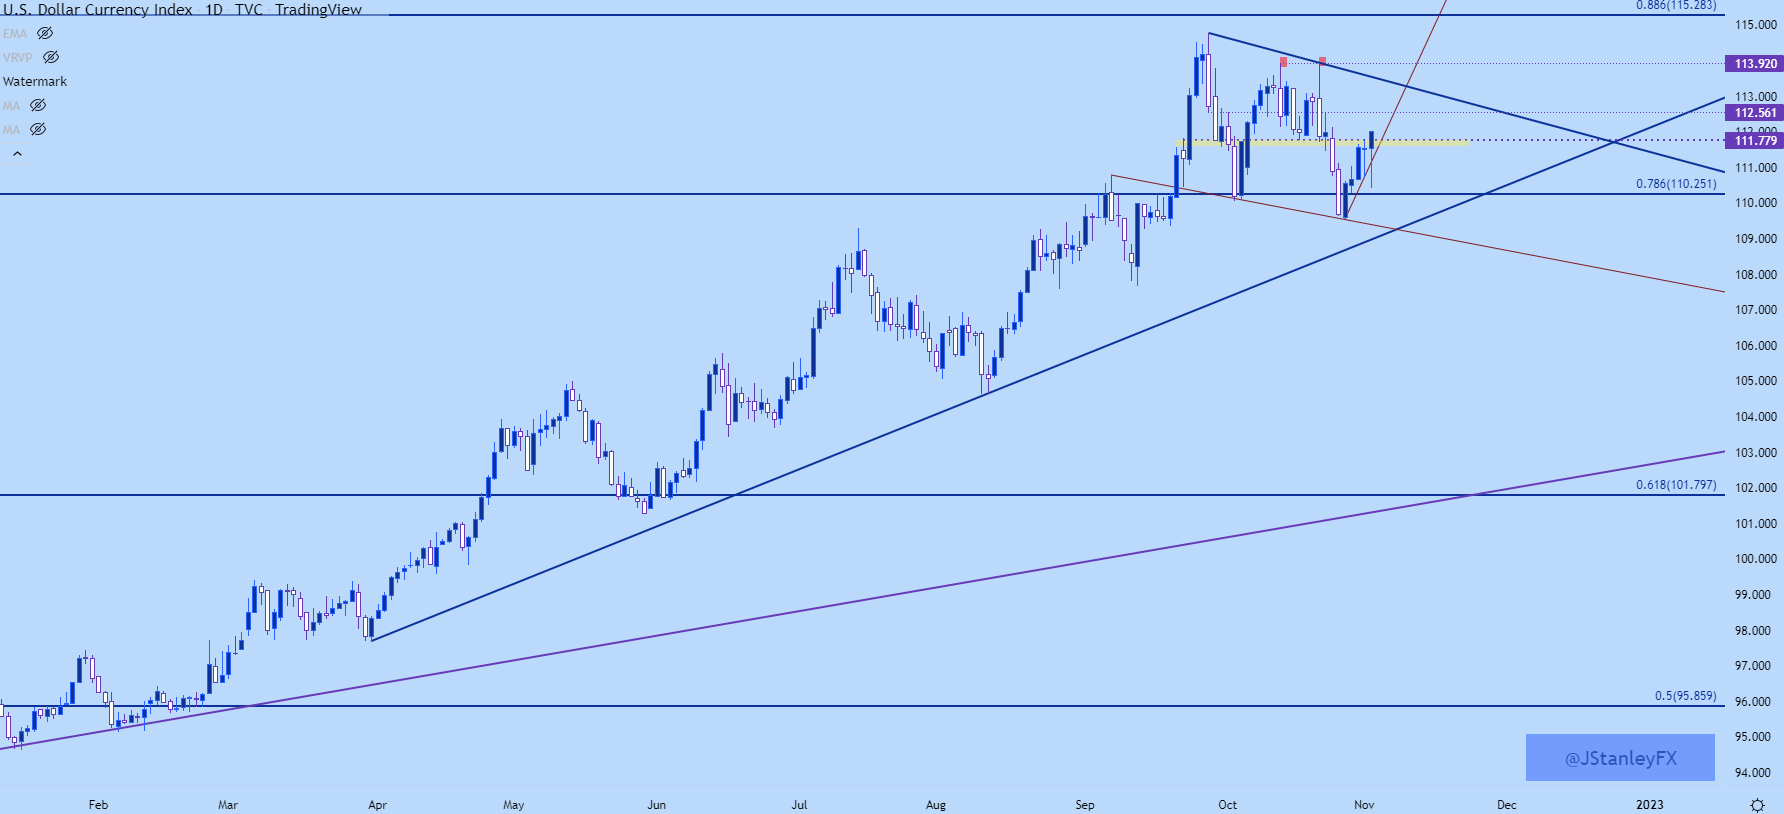
Chart prepared by James Stanley; USD, DXY on Tradingview
EUR/USD
If we look at today’s FOMC rate decision next to last week’s ECB, there’s really no comparison as to who is more-hawkish. Of course each Central Bank is working with different scenarios in their representative economies but even with inflation in Europe eclipsing 10%, the bank doesn’t seem to want to commit to anything of note in the future. Meanwhile, the Fed is making a clear-case that they’re not done yet.
There was a large impact that showed in EUR/USD today as a quick run of strength in the pair was soundly faded and prices have pushed right back down to a fresh low. This extends the series of lower-lows and lower-highs, keeping the door open for bearish continuation scenarios. I’m tracking next support at .9808, after which .9750 comes into the picture. And prior support, around .9862, now becomes resistance potential in the pair for bearish continuation scenarios.
EUR/USD Four-Hour Price Chart
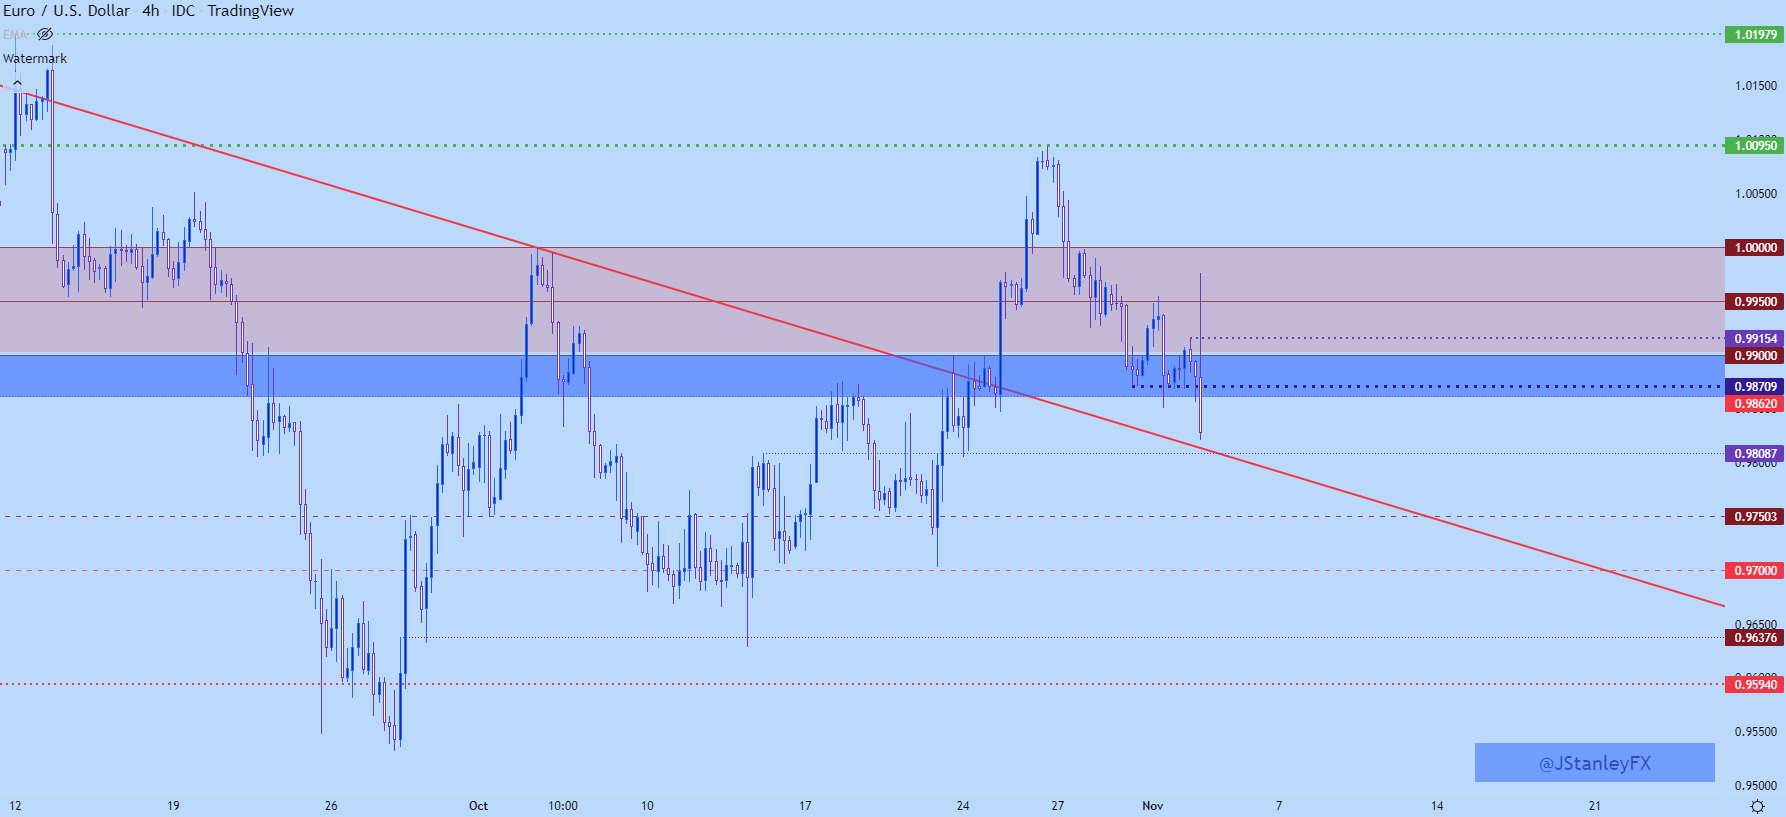
Chart prepared by James Stanley; EURUSD on Tradingview
--- Written by James Stanley, Senior Strategist, DailyFX.com & Head of DailyFX Education
Contact and follow James on Twitter: @JStanleyFX


