


Euro, EUR/USD, US Dollar, Trend, Momentum, Bollinger Bands - Talking points
- EUR/USD enduring trend survived a downside test but might be pausing
- EUR/CHF is still in the range and appears to have settled in for the time being
- There might be a bullish case for Euro. Will EUR/USD resume the ascension?
Trade Smarter - Sign up for the DailyFX Newsletter
Receive timely and compelling market commentary from the DailyFX team
EUR/USD TECHNICAL ANALYSIS
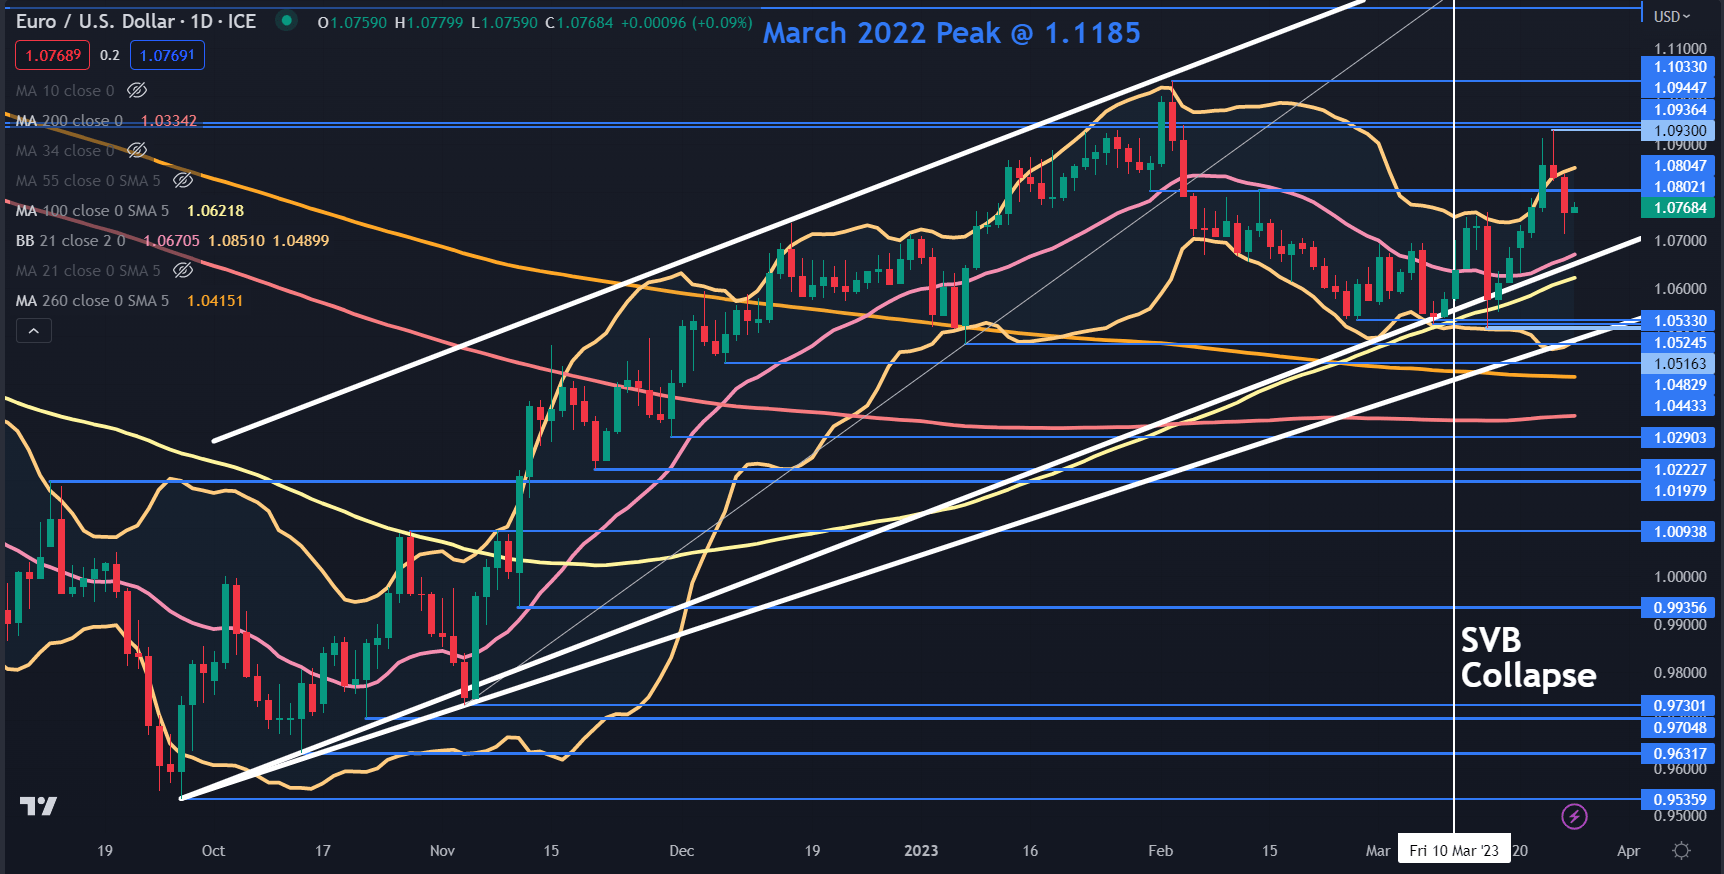
EUR/USD remains in an ascending trend channel after challenging the lower bound earlier this month ahead of the collapse of SVB Financial. An event that sent markets into a tailspin.
It tried to have another look lower post-collapse, but the 100-day simple moving average (SMA) appears to have lent some support just below that ascending trendline. These two lines may continue to provide support, currently in the 1.0620 – 1.0640 vicinity.
Below there, is another ascending trendline which is in amongst a series of recent lows and might provide a support zone in the 1.0515 -1.0535 area.
As the US Dollar came under pressure last week, EUR/USD scampered to a high of 1.0930, which was just below two breakpoints at 1.0936 and 1.0945. These levels could offer resistance ahead of the 12-month peak at 1.1033.
The recent rally broke above the upper band of the 21-day SMA-based Bollinger Band. On Friday, it closed back inside the band and that might signal a pause in the bullish run or a potential reversal.
At the least, the widening of the bands themselves could be suggestive of increasing volatility.

EUR/CHF TECHNICAL ANALYSIS
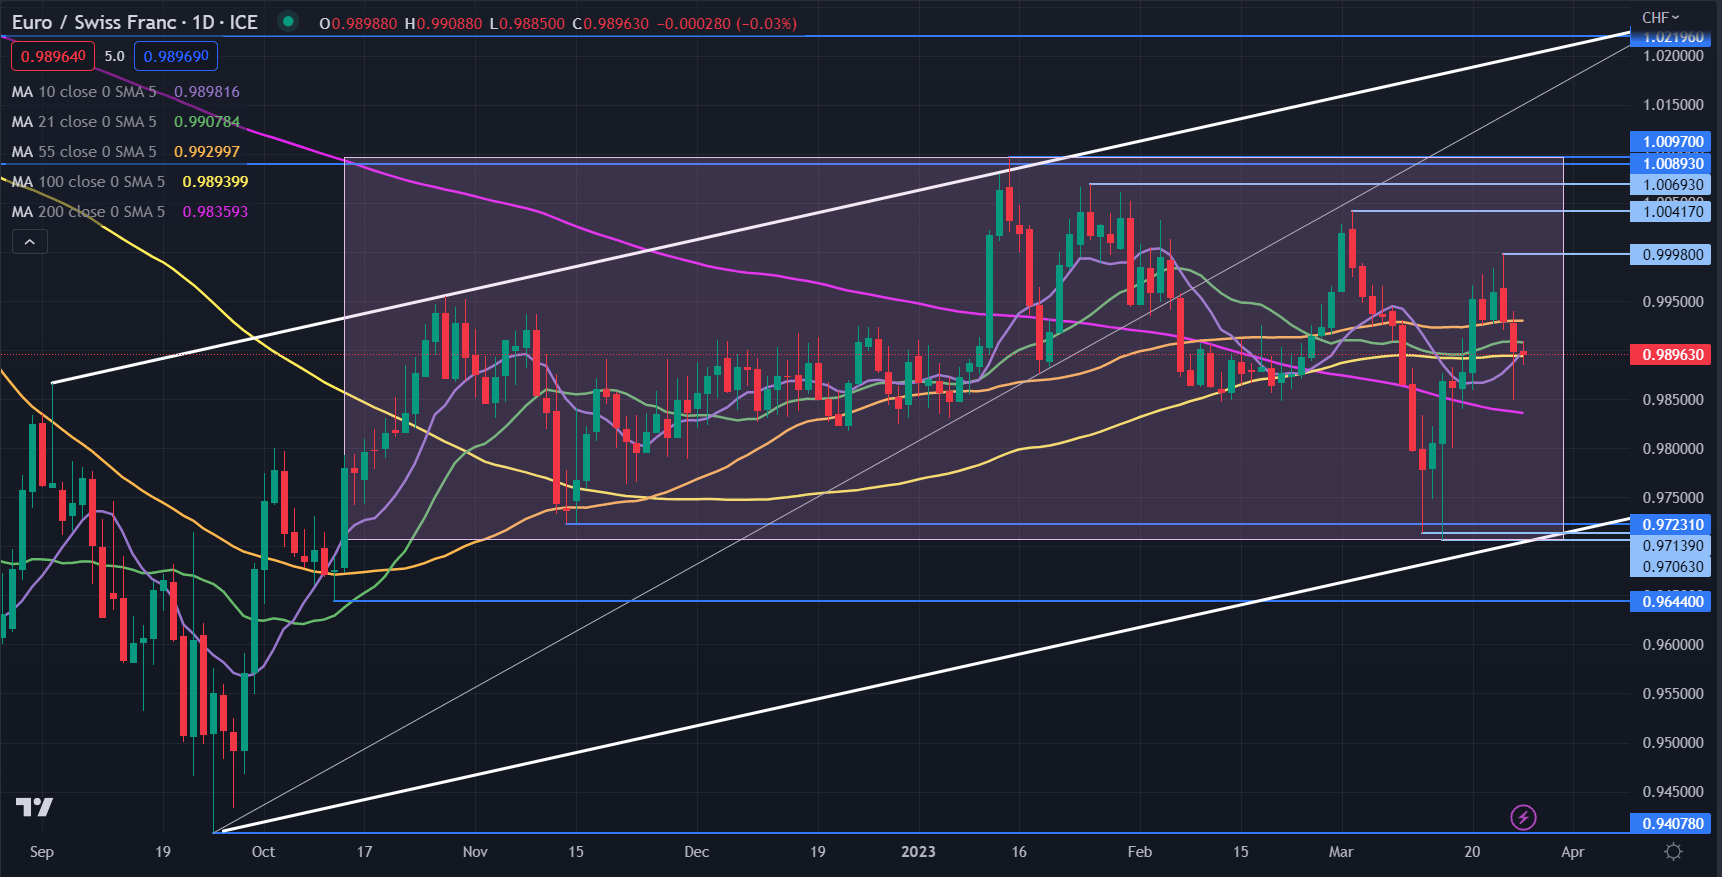
EUR/CHF has been caught within a 0.9700 – 1.0100 range for five months. In this time it has narrowly broke above resistance and below support levels.
These false breaks may confirm the challenging range trading environment seen across several asset classes.
Further evidence of the range trading environment shows that 10-, 21-, 55-, 100- and 200-day SMAs are all within 0.9835 and 0.9930 with the price hovering near the middle of this range.
The bigger picture reveals that the price remains in an ascending trend channel. The lower band of this channel currently coincides with the previous lows in the 0.9706 – 0.9723 area and may provide support.
On the topside, the prior peaks of 0.9998, 1.0042, 1.0069 and 1.0097 might offer resistance. The latter is just above potential breakpoint resistance at 1.0089.
--- Written by Daniel McCarthy, Strategist for DailyFX.com
To contact Daniel, use the comments section below or @DanMcCathyFX on Twitter


