


Euro, EUR/USD, US Dollar, Bollinger Bands, Volatility, Island Reversal, Fibonacci - Talking points
- Euro bearishness has unfolded with some signals having added weight
- EUR/USD price action has seen mixed volatility outcomes with event risk looming
- 1.1130 might be pivotal for EUR/USD direction. Will it test higher?

EUR/USD TECHNICAL ANALYSIS
The mid-July peak of 1.1275 traded outside the upper band of the 21-day simple moving average (SMA) based Bollinger Band.
After it closed back inside the band, it opened up a bearish run over the next few days as discussed here at the time.
Not surprisingly, the width of the Bollinger Bands has narrowed as the price has retraced. This indicates that historical volatility has decreased. This is a measure of the price action in the past.
At the same time, the one month at the money (ATM) implied volatility has been ticking higher.
It has climbed back over 7% this week after visiting below 6% in June. This is the market pricing of forward-looking price volatility.
This should not come as a surprise given the event risk this week with monetary policy meetings for both the Federal Reserve and the European Central Bank.
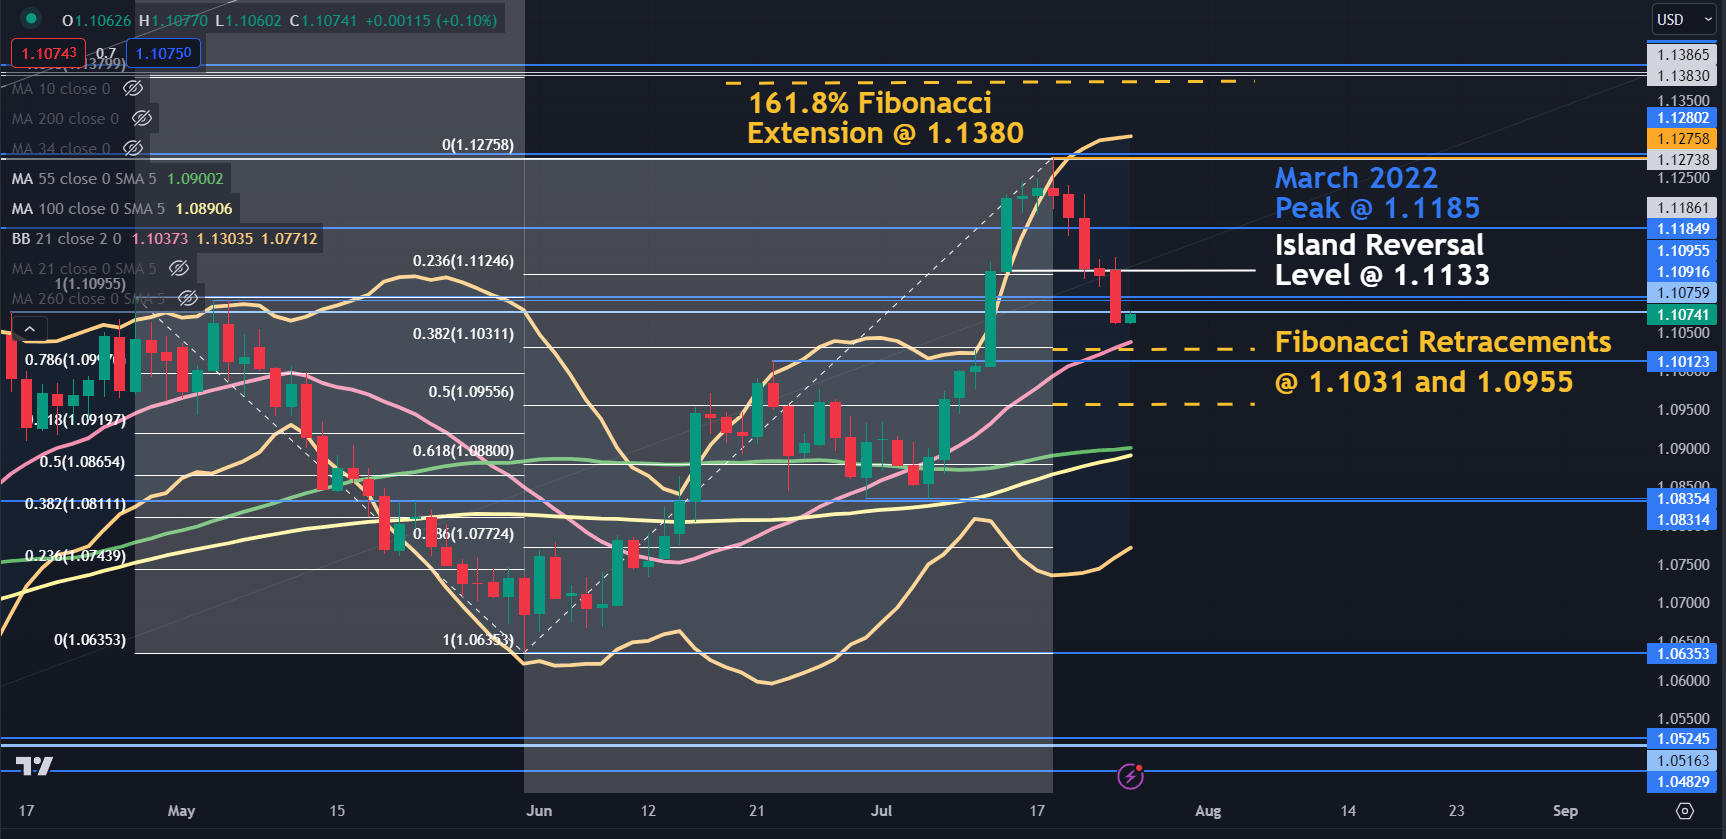
After closing back inside the aforementioned Bollinger Band, it has since confirmed an Island Reversal pattern after it broke below 1.1133, as highlighted here last Friday. A move back above 1.1133 would negate this signal.
An Island Reversal occurs when there is a gap in price action that extends the bullish or bearish trend. After the price reaches its zenith or nadir, the price action then makes another gap in the price in the opposite direction to where the first gap occurred.
If the Island Reversal is unwound, the 1.1275 – 80 area may offer resistance as the high there on July 18th coincides with some historical breakpoints.

Further up, resistance might be at the 161.8% Fibonacci Extension of the move from 1.1095 to 1.0635 at 1.1380. Just above there are some more breakpoints in the 1.1385 – 95 area.
Nearby resistance could be at the breakpoints of 1.1076, 1.1095 and 1.1185.
On the downside, support could be near the 38.2% and 50% Fibonacci Retracement levels at 1.1031 and 1.0955 respectively. Between those levels, the breakpoint at 1.1012 may provide support.
Below those levels lie the 55- and 100-day SMAs that might lend support in the 1.0890 – 1.0900 area.
Further down, there are a series of prior lows and breakpoints between 1.0830 and 1.0835 that could provide a support zone.
{{GUIDE|HOW_TO_TRADE_EURUSD}}
EUR/USD DAILY CHART
--- Written by Daniel McCarthy, Strategist for DailyFX.com
To contact Daniel, use the comments section below or @DanMcCathyFX on Twitter


