


Euro, EUR/USD, US Dollar, Bollinger Bands, Island Reversal, Fibonacci - Talking points
- The Euro bullishness has paused with technical indicators asking questions
- EUR/USD price action going into the weekend may reveal short-term direction
- If EUR/USD closes below 1.1130 today, will it run lower?

EUR/USD TECHNICAL ANALYSIS
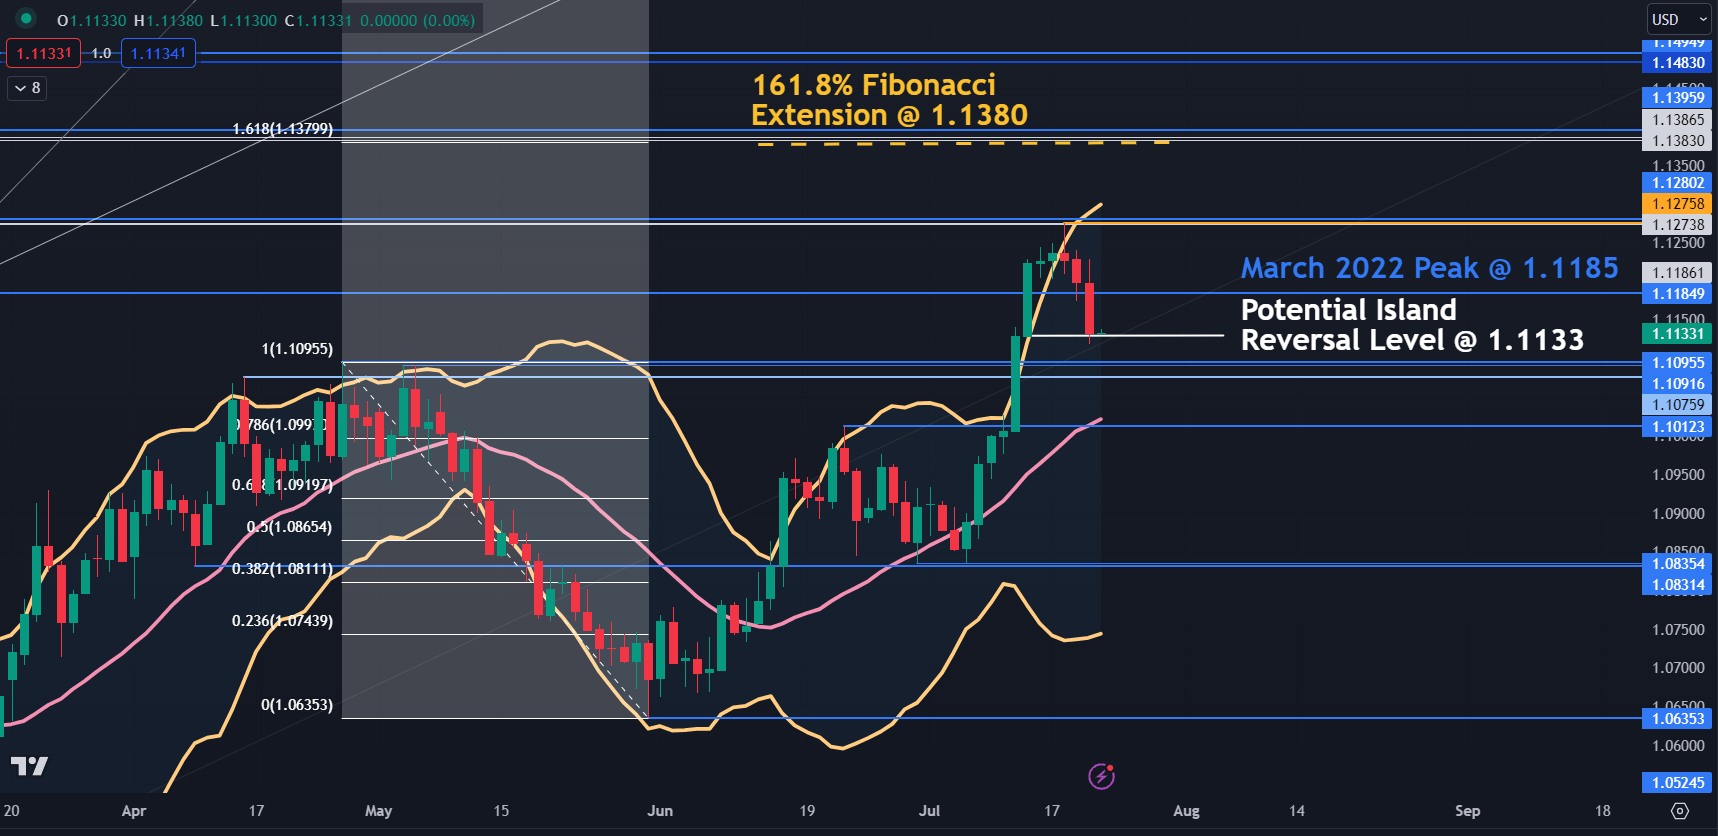
Last week’s rally has broken above the upper band of the 21-day simple moving average (SMA) based Bollinger Band.
When it closed back inside earlier this week, it opened up a bearish run over the next few days as discussed here on Tuesday.
The bears may look to add exposure if there is a close below 1.1133, as it would set up an island reversal candlestick pattern.
An Island Reversal occurs when there is a gap in price action that extends the bullish or bearish trend. After the price reaches its zenith or nadir, the price action then makes another gap in the price in the opposite direction to where the first gap occurred.
Strictly speaking, it is rare for an Island Reversal to occur in free-floating foreign exchange markets as they do not close during the working week.
The continuous trading of currencies means that the daily close and next open are almost identical. In general, the change in price reflects the interest rate differential between the two currencies.
Exchange-traded financial market products, such as equities and futures, generally close for a period each day. This allows new information to be disseminated before the next open and the price may move significantly from where it closed, enabling a gap.

So, for EUR/USD, a close below 1.1133 may indicate that an Island Reversal has evolved. If it does close below that level, the further below 1.1133 that it occurs, the more comfort the bears might find.
Support could be at the breakpoints in the 1.1075 – 1.1095 zone and lower down at 1.1010.
On the topside, resistance could be at the breakpoint from the March 2022 high at 1.1185 or the recent peak at 1.1275, which coincides with two historical breakpoints.
Further above those levels, resistance might be at the Fibonacci Extension of the move from 1.1095 to 1.0635 at 1.1380. Just above there are some more breakpoints in the 1.1385 – 95 area.
EUR/USD DAILY CHART
--- Written by Daniel McCarthy, Strategist for DailyFX.com
To contact Daniel, use the comments section below or @DanMcCathyFX on Twitter


