


Euro, EUR/USD, US Dollar, EUR/JPY, Japanese Yen - Talking points
- EUR/USD has tumbled from a 10-month peak seen earlier this month
- EUR/JPY has consolidated near 2-month highs with potential momentum building
- If the US Dollar contuse to gain, how low will EUR/USD go?
Trade Smarter - Sign up for the DailyFX Newsletter
Receive timely and compelling market commentary from the DailyFX team
EUR/USD TECHNICAL ANALYSIS
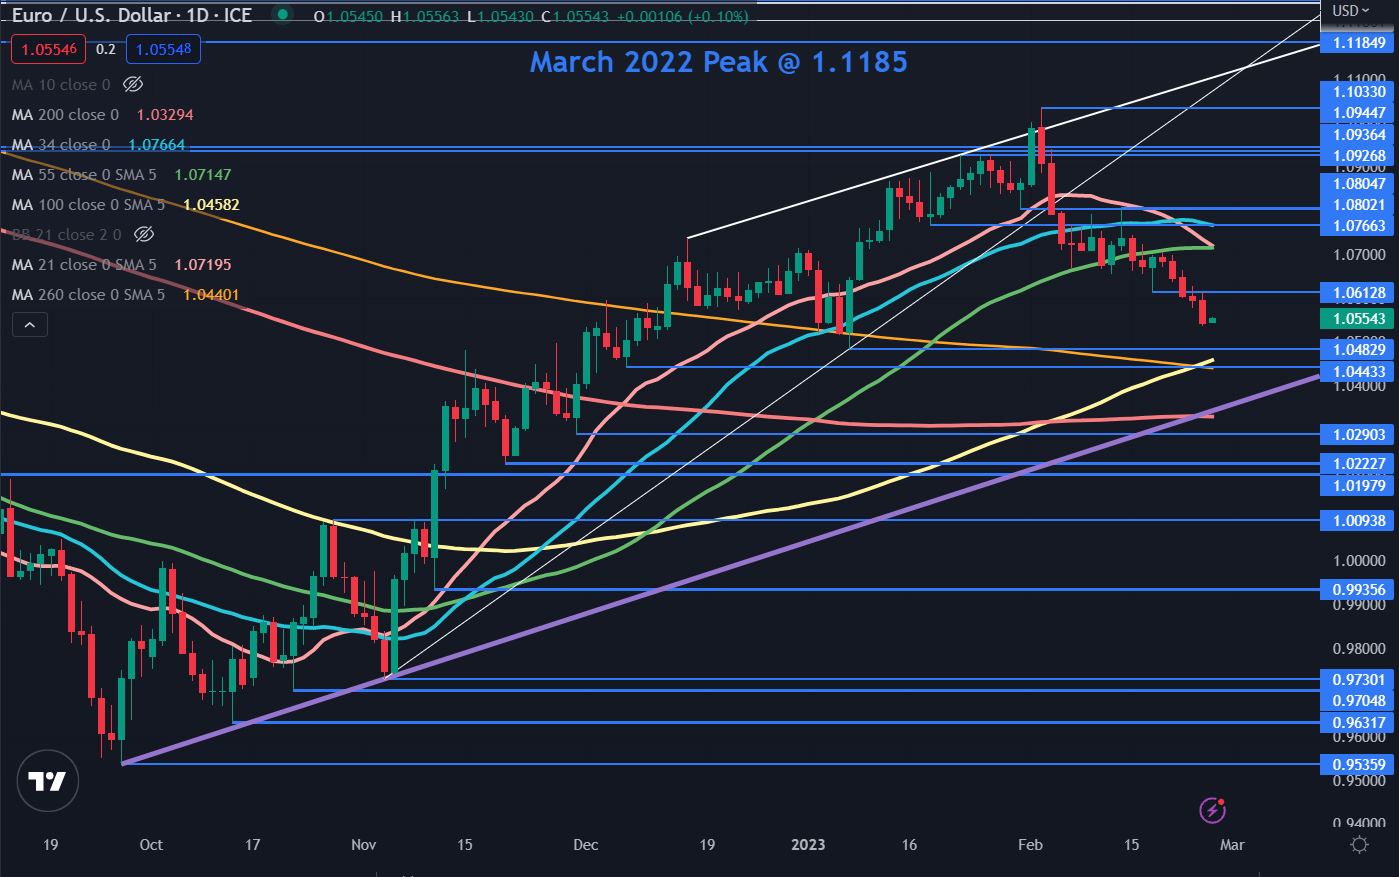
EUR/USD made a 10-month high at the start of this month before retracing lower in sync with broad-based US Dollar support.
That move down saw the price break below an ascending trend line but despite the slide, EUR/USD remains in a bigger picture ascending trend channel
The 100-, 200- and 260-day simple moving averages (SMA) remain below the price while the 10-, 21-, 34 and 55-day SMAs are above the price. This may indicate that long-term bullish momentum might be intact for now, but short and medium-term momentum could be bearish.
The 100- and 260-day SMAs are near the prior lows of 1.0443 and 1.0483 and this may set up a support zone. Further down, the ascending trend line is near the 200-day SMA near 1.0330 and is a potential support level.
Under there, the prior lows and breakpoints at 1.0290, 1.0223, 1.0198 and 1.0094 may provide support.
Above the price, the 21-day SMA is close to crossing below the 55-day SMA. If this occurs, it will signal a Death Cross and could suggest that bearish momentum may unfold.
The 34-day SMA is near the breakpoint of 1.0766 and may offer resistance ahead of the previous peak and breakpoint near 1.0805.

EUR/JPY TECHNICAL ANALYSIS
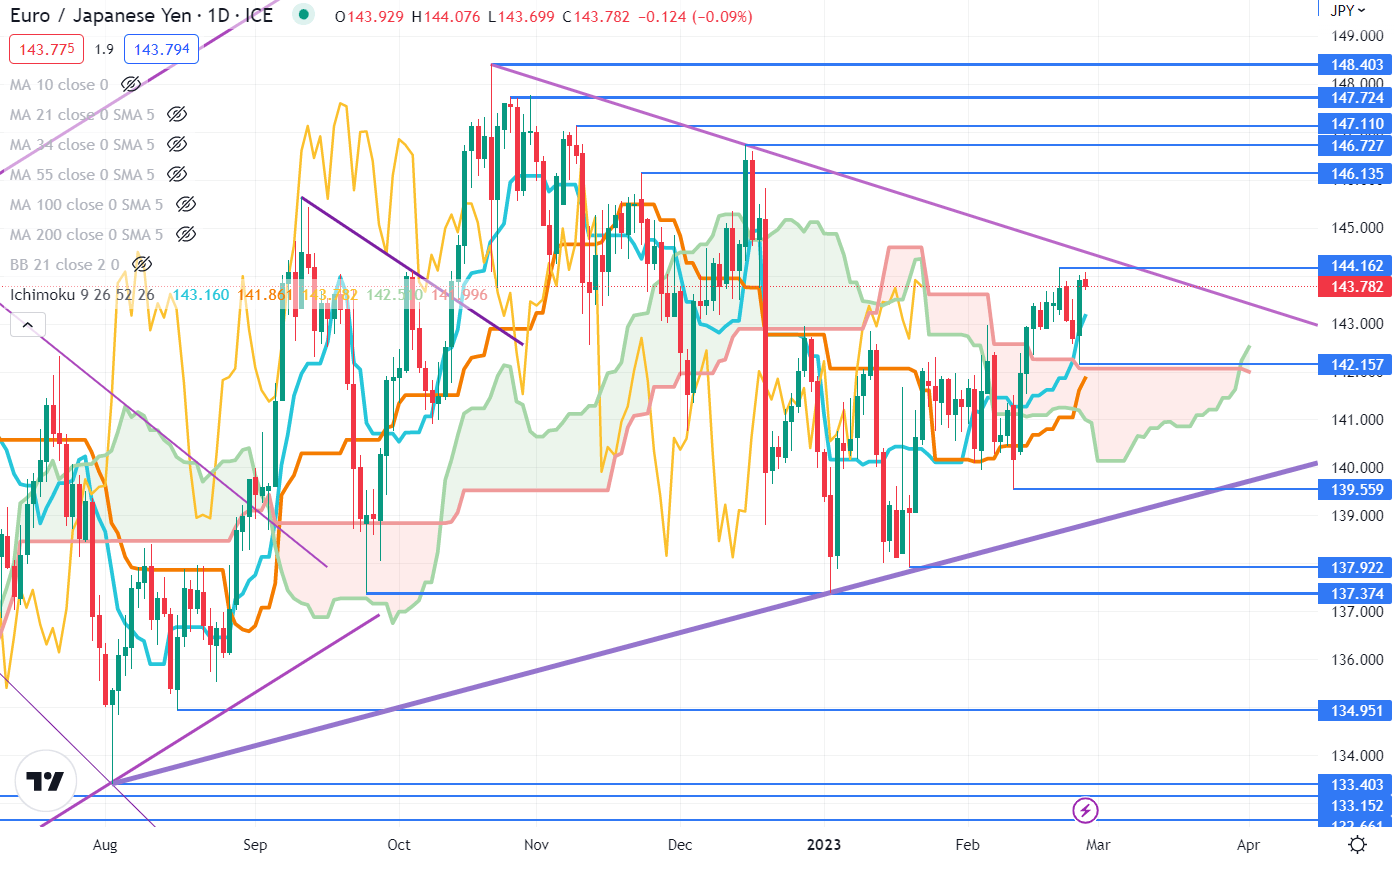
The Japanese Yen has depreciated against the Euro of late after EUR/JPY broke above the Ichimoku Kinko Hyo, which is often referred to as the Ichimoku Cloud.
Two weeks ago, the price moved above the Senkou Span A (Leading Span A) and the Senkou Span B (Leading Span B) to potentially indicate that bullish momentum could unfold.
Stepping back, there could also be a potential bullish Pennant Formation evolving with a descending trendline above the price and an ascending trendline below the price. These trendlines may offer resistance and support respectively before a possible breakout.
Resistance might be at the prior peaks of 144.16, 146.73, 147.11, 147.72 and 14840. On the downside, support could be at the previous lows of 142.16, 136.55, 137.92 and the Double Bottom at 137.37.
--- Written by Daniel McCarthy, Strategist for DailyFX.com
To contact Daniel, use the comments section below or @DanMcCathyFX on Twitter


