


Euro, EUR/USD, US Dollar, EUR/JPY, Japanese Yen - Talking points
- EUR/USD has tumbled from a 2-month peak after reversals kicked in
- EUR/JPY has adjourned its ascending run at lofty levels as it eyes a new high
- If Euro regathers support, have we seen the bottom in EUR/USD?

EUR/USD TECHNICAL ANALYSIS
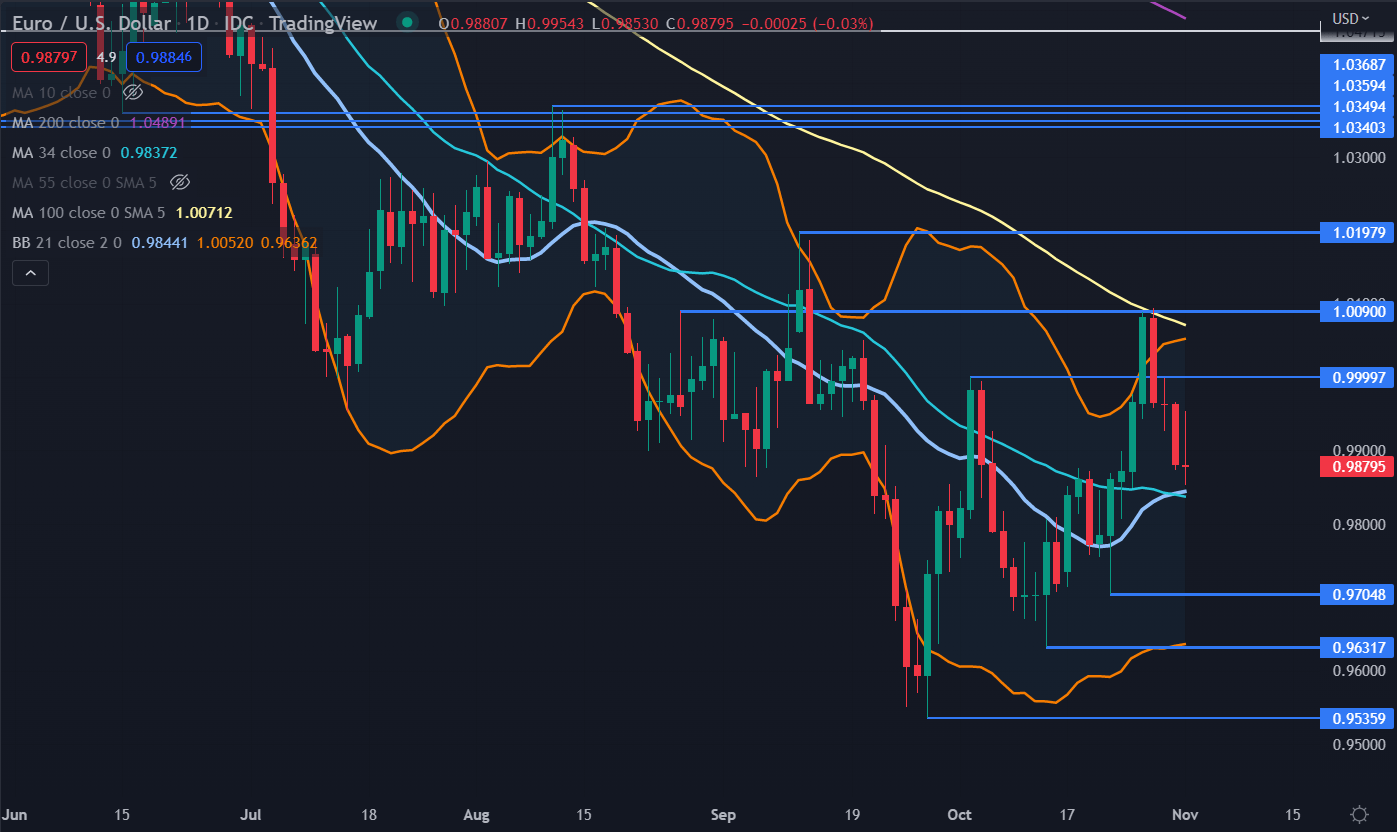
EUR/USD made a solid recovery through October after bouncing off a 20-year low seen in late September.
The price action pushed up toward a break point at 1.0090 that coincided with the 100-day simple moving average (SMA) but failed to overcome it. This level may continue to offer resistance ahead of the September high of 1.0198.
Further up, there is a cluster of break points and a previous peak in the 1.0340 – 1.0370 area and that zone could offer resistance.
The high of 1.0090 last week moved outside of the upper band of the 21-day SMA based Bollinger Band. Once the price closed back inside the band, a reversal unfolded.
The day that the high was made last week also saw the price close much lower to form a Bearish Engulfing Candlestick.
Looking very closely at the price opens and closes on the two days in question would make the formation marginal, but due to the way FX rolls over from one trading day to another, this would still be considered a Bearish Engulfing Candlestick.
Nearby support could be at the 21- and 34-day SMAs that are currently at 0.9844 and 0.9837 respectively.
Further down, support may lie at the prior lows of 0.9705, 0.9632 and 0.9536.

EUR/JPY TECHNICAL ANALYSIS
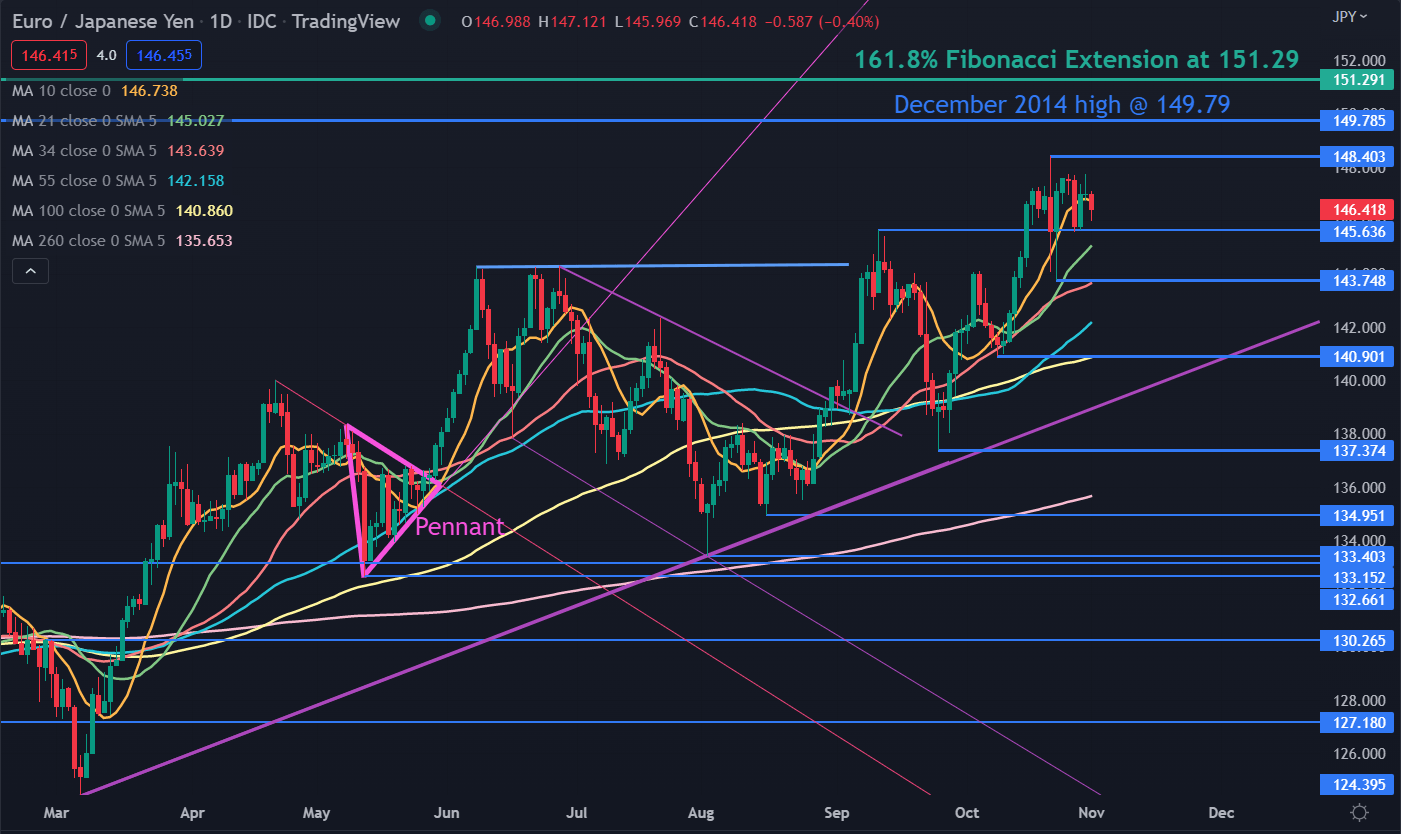
EUR/JPY has consolidated over the past week after making an 8-year high last month. This range trading environment is illustrated by the price criss-crossing the 10-day SMA.
Underlying medium and long-term bullish momentum might be intact. A bullish triple moving average (TMA) formation requires the price to be above the short term SMA, the latter to be above the medium term SMA and the medium term SMA to be above the long term SMA. All SMAs also need to have a positive gradient.
Looking at the 21-, 34, 55-, 100-, 260-day SMAs, the criteria for a TMA have been met. If the price moves above the 10-day SMA and its gradient turns positive this could see short-term bullish momentum unfold.
Resistance might be at the recent peak of 148.40, the December 2014 high of 149.79 or Fibonacci Extension level at 151.29.
Support may lie at the break point of 145.64 or the prior lows of 143.75, 140.90, 137.37 and 134.95.
--- Written by Daniel McCarthy, Strategist for DailyFX.com
To contact Daniel, use the comments section below or @DanMcCathyFX on Twitter


