


US Dollar, Euro, EUR/USD - Technical Outlook:
- EUR/USD has pulled back from a tough resistance area.
- The retreat is an early sign that EUR/USD could be settling in a range in the short term.
- What are the key signposts to watch?

EUR/USD SHORT-TERM TECHNICAL FORECAST – NEUTRAL
The sharp fall toward the end of last week could be a sign that the Euro’s four-month-long rally is losing steam.
EUR/USD dropped after US jobs and services data beat expectations, leading to a repricing higher in US rate expectations. Rate futures now indicate the Fed to hike at least two more rate hikes, taking the benchmark to above 5%. Before Friday’s data, the market was expecting the benchmark rate to peak below 5%.
This follows a 25 basis points hike by the US Federal Reserve and a 50 basis points hike by the European Central Bank (ECB) last week. While the Fed acknowledged early signs of disinflation, Chair Powell said the central bank could conduct a few more rate hikes to bring down inflation to its target. The ECB, on the other hand, maintained its hawkish stance. On balance, while ECB wasn’t incrementally hawkish, the Fed wasn’t as dovish as some had expected, weighing on EUR/USD.
EUR/USD Weekly Chart
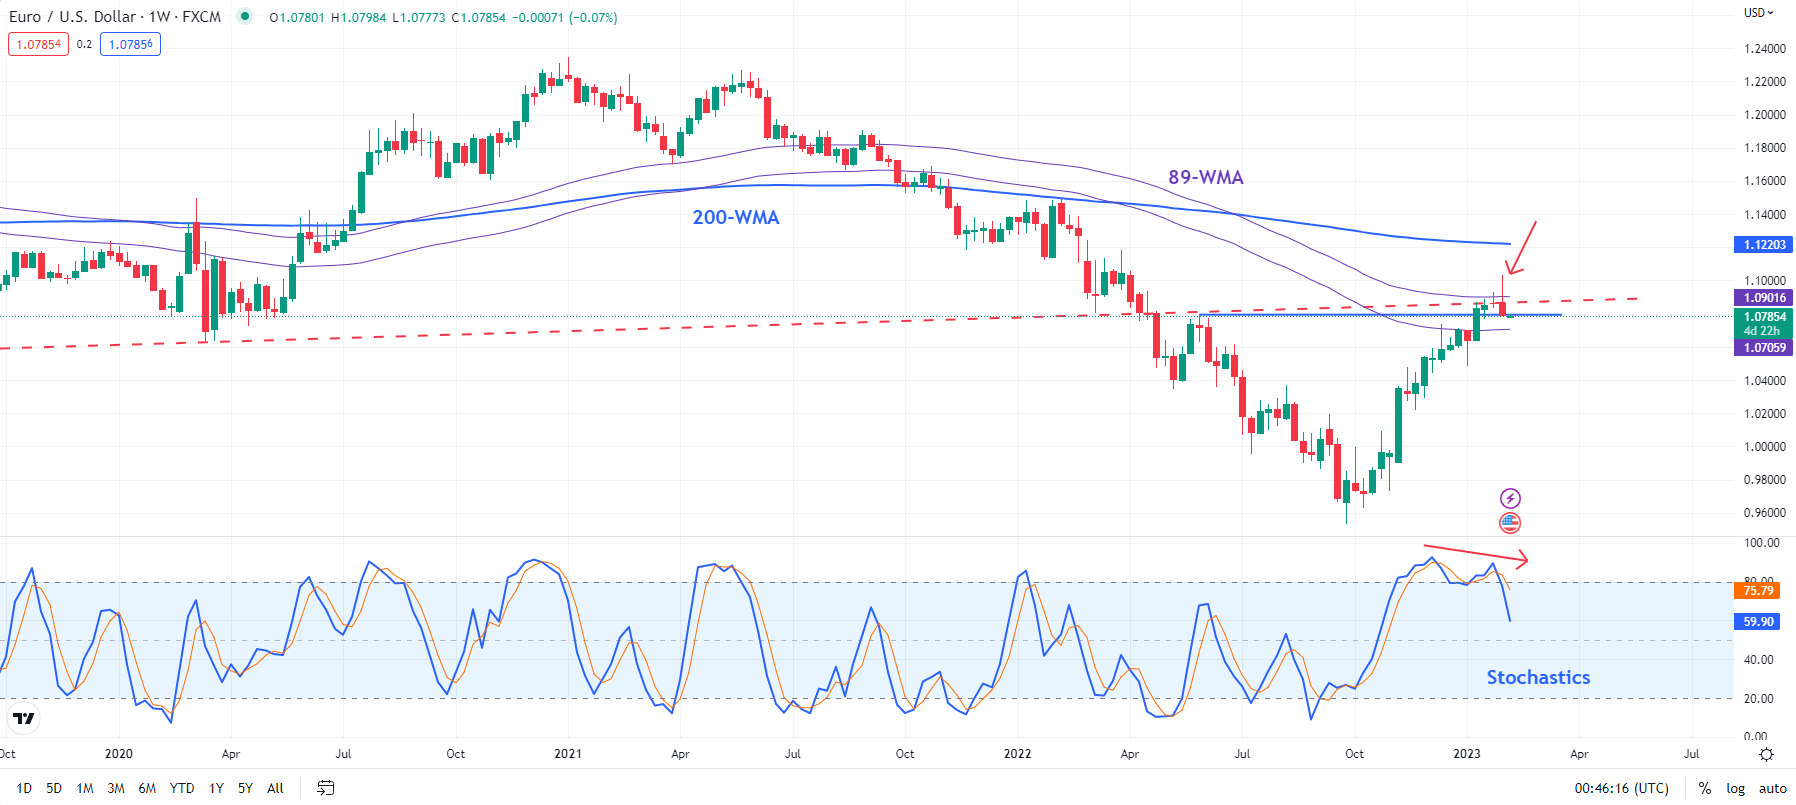
Chart Created Using TradingView
On technical charts, EUR/USD had been struggling to extend gains in recent weeks ahead of stiff resistance around 1.0900, including the 89-week moving average and a slightly upward-sloping trendline from 2017,as pointed out a couple of weeks ago. Moreover, a negative momentum divergence on the daily and weekly charts (softening Stochastics as the spot has made new highs) raised the odds of a pause/minor setback in the near term, as highlighted last week.
EUR/USD Daily Chart
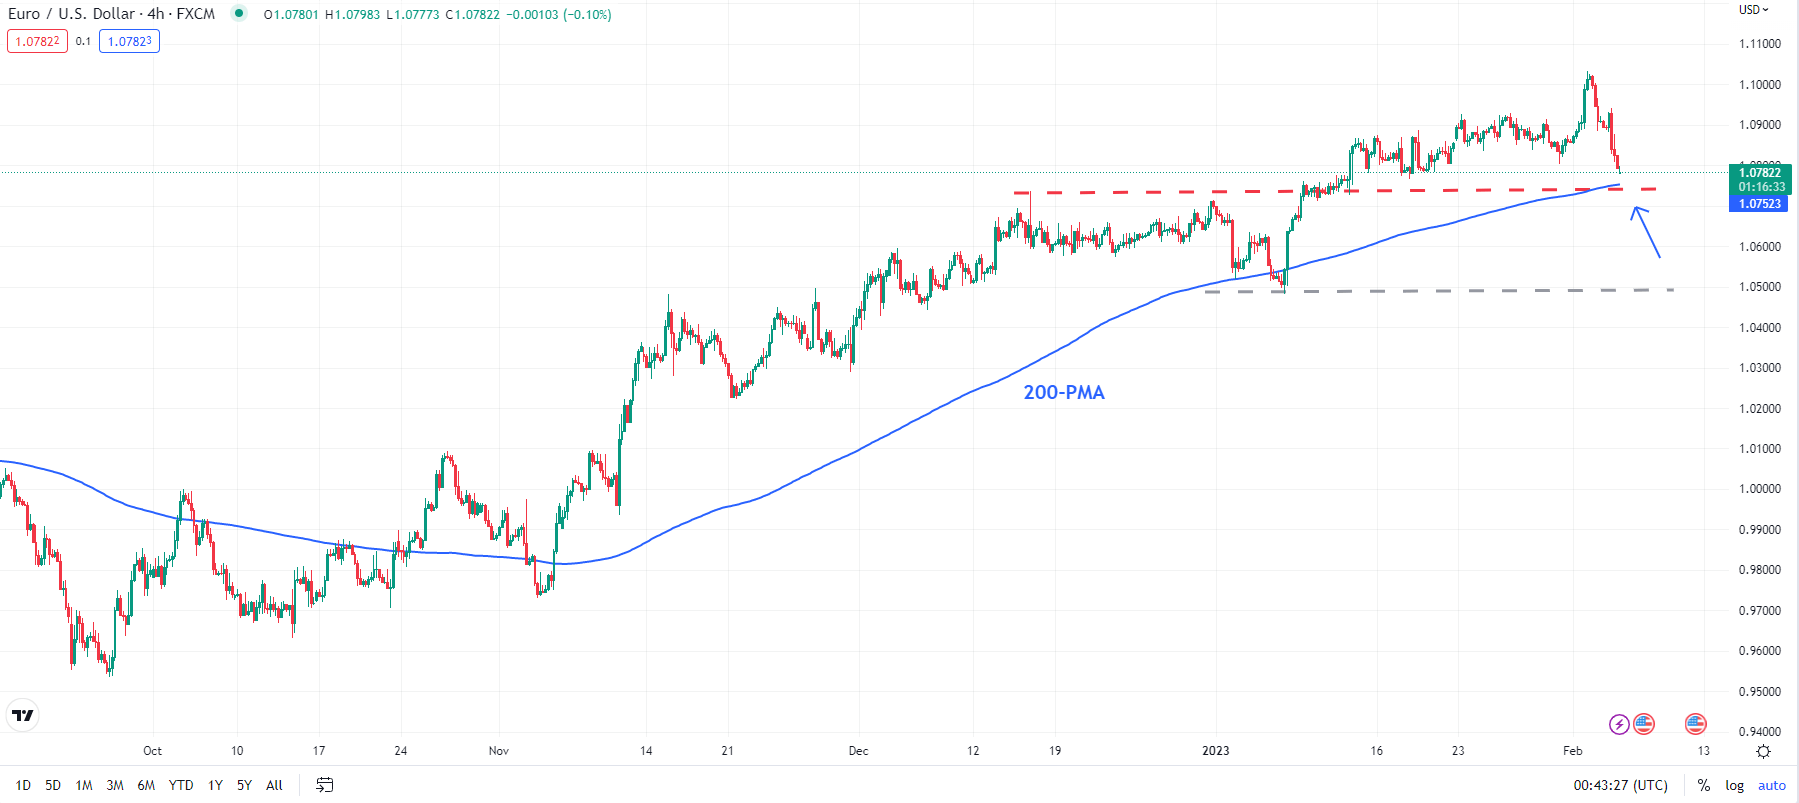
Chart Created Using TradingView
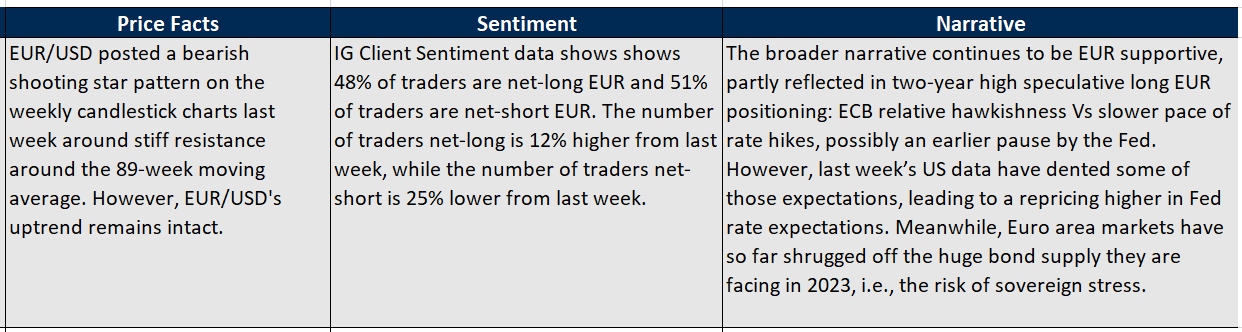
EUR/USD posted a bearish shooting star pattern on the weekly candlestick charts and is now approaching important support at about 1.0700-1.0750 (see the 240-minute chart). EUR/USD hasn’t been able to decisively break below the 200-period moving average on the 240-minutes charts, suggesting that 1.0700-1.0750 could be tough to break, at least in the first attempt.
However, any break below the support would confirm that the upward pressure had faded, pointing to the possibility of an extended range in the short term. Subsequent support is at the January low of 1.0480. Strong support is on the 200-day moving average (now at about 1.0320). The uptrend since late 2022 is unlikely to reverse while EUR/USD holds above the long-term moving average.
--- Written by Manish Jaradi, Strategist for DailyFX.com


