


Dow Jones, S&P 500, Retail Trader Positioning, Technical Analysis – IGCS Equities Update
- Dow Jones and S&P 500 have been cautiously weakening
- Retail traders continue increasing upside exposure in them
- From a contrarian view, this is an increasingly bearish signal

The Dow Jones and S&P 500 have been aiming cautiously lower in recent weeks. Retail traders have been responding by increasing their upside exposure. This can be seen by looking at IG Client Sentiment (IGCS). IGCS tends to function as a contrarian indicator. As such, if this trend in positioning continues, more pain could be in store for Wall Street.
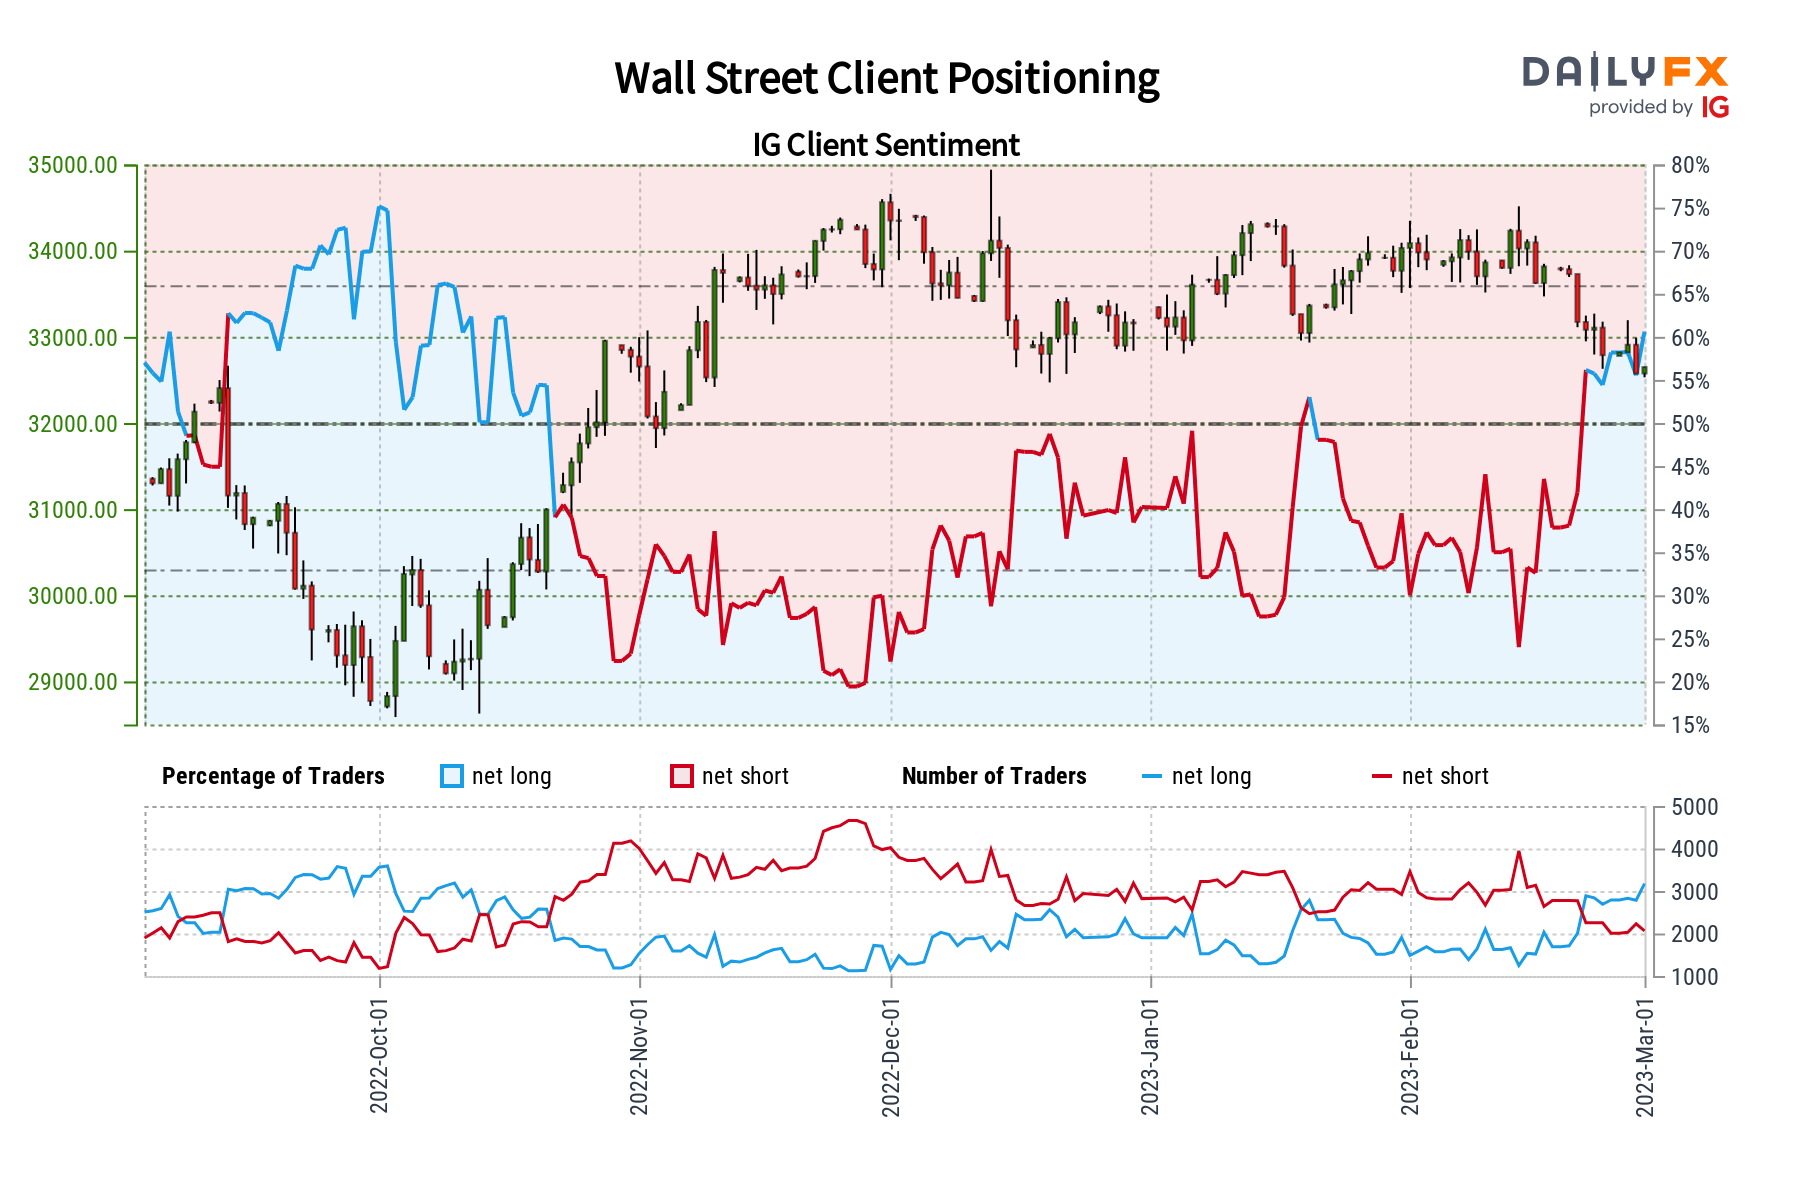
Dow Jones Sentiment Outlook - Bearish
According to IGCS, about 61% of retail traders are net-long the Dow Jones. Since most traders are net-long, this hints prices may continue falling. This is as upside exposure increased by 11.91% and 10.78% compared to yesterday and last week, respectively. With that in mind, the combination of current sentiment and recent changes offers a stronger bearish contrarian trading bias.
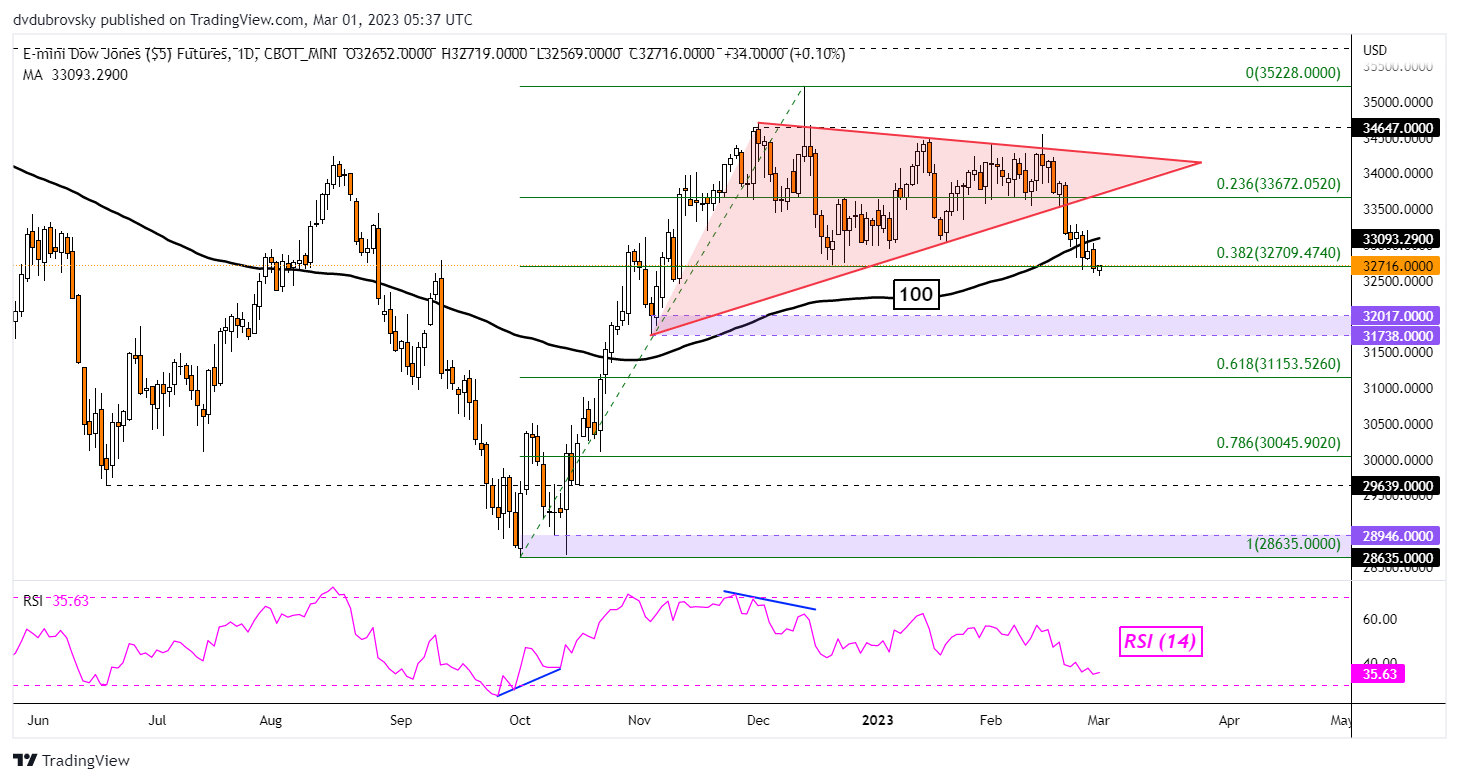
Dow Jones Futures Technical Analysis
On the daily setting, the Dow Jones has confirmed a breakout under a Symmetrical Triangle chart pattern as well as the 100-day Simple Moving Average (SMA). Prices are also testing a drop under the 38.2% Fibonacci retracement level at 32709. That has exposed the 31738 – 32017 support zone towards lows from October. Immediate resistance seems to be the 23.6% level at 33672.
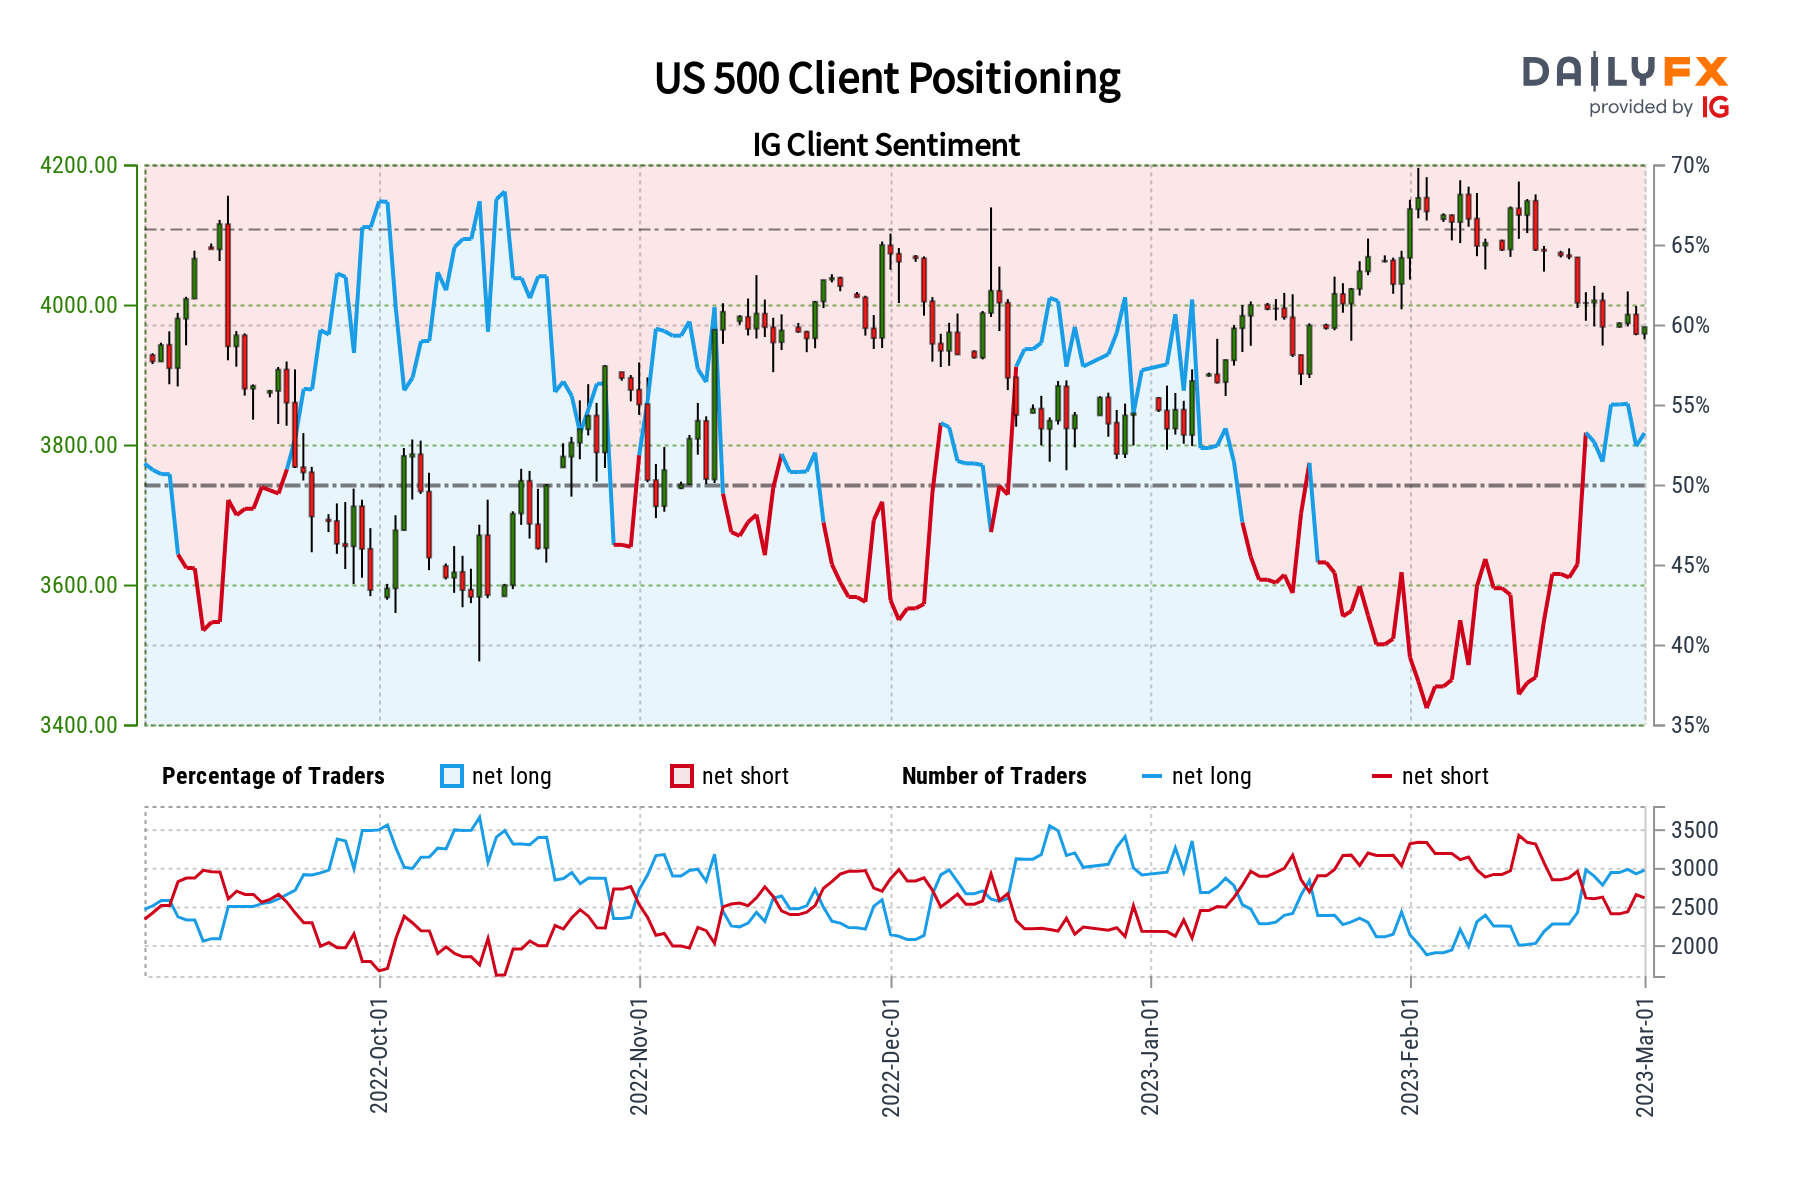
S&P 500 Sentiment Outlook - Bearish
According to IGCS, about 54% of retail traders are net-long the S&P 500. Since most of them hold upside exposure, this hints prices may continue falling. This is as downside exposure has decreased by 4.54% and 3.56% compared to yesterday and last week, respectively. With that in mind, the combination of current sentiment and recent changes offers a stronger bearish contrarian trading bias.

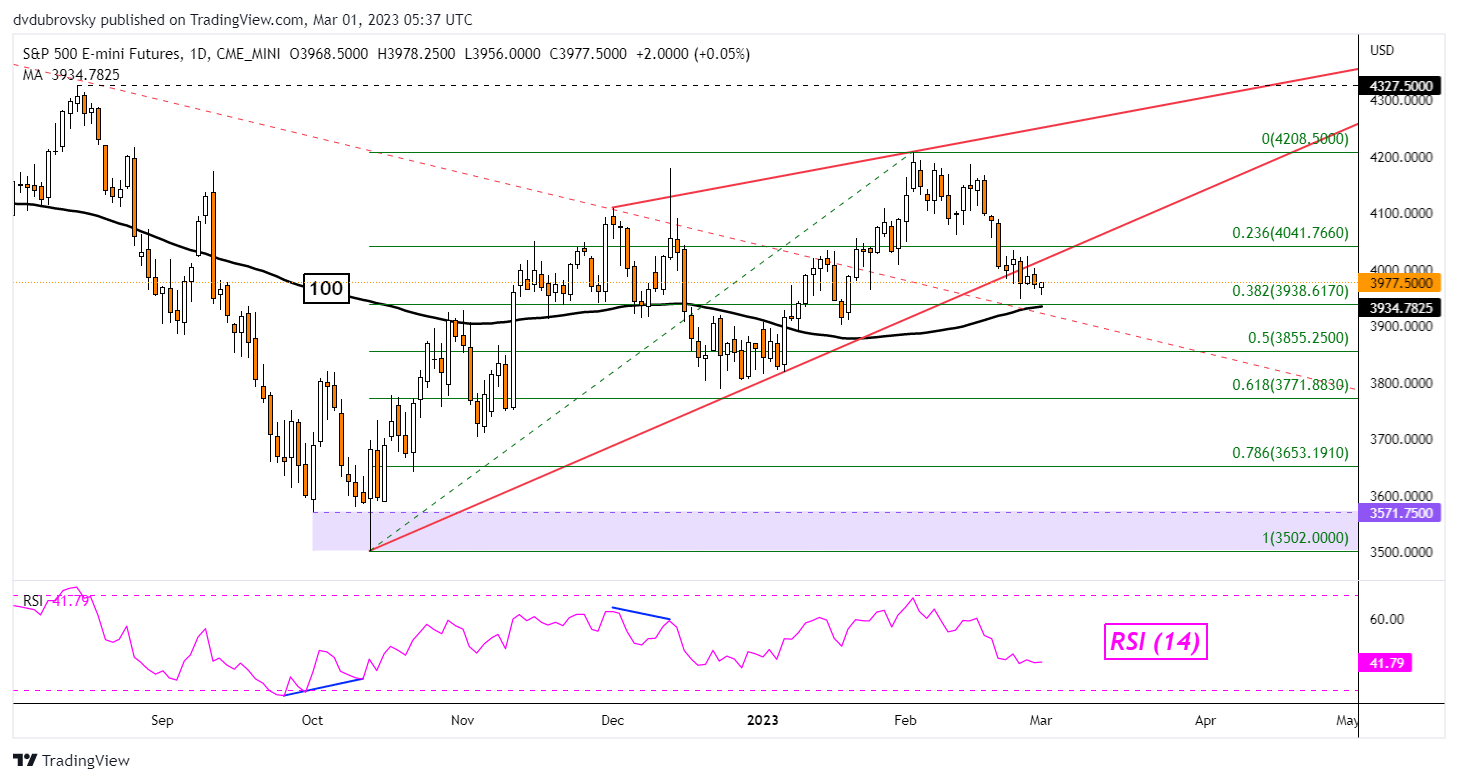
S&P 500 Futures Technical Analysis
S&P 500 futures have been making cautious downside exposure under a bearish Rising Wedge chart formation. Having said that, notable progress lower has been somewhat lackluster. Immediate support is a combination of the 38.2% level at 3938 as well as the 100-day SMA. Confirming a breakout through these points could set the stage for a prolonged downside move. Otherwise, rising back into the wedge would offer an increasingly bullish technical perspective.
--- Written by Daniel Dubrovsky, Senior Strategist for DailyFX.com
To contact Daniel, follow him on Twitter:@ddubrovskyFX


