


DJIA, DOW JONES INDUSTRIAL AVERAGE - Technical Outlook:
- DJIA is testing strong converged support
- ‘Fear’ level is running high; market positioning is quite light
- A short-term bounce on the cards and what are the key levels to watch?

SHORT-TERM REBOUND, MEDIUM-TERM PAIN
Excessive pessimism stretched positioning and developments on technical charts suggest the Dow Jones Industrial Average’s (DJIA) five-week slide could be about to pause. However, it would be too soon to conclude that the worst for US stocks is over.
On technical charts, the DJIA index is testing strong converged support on the 200-week moving average, coinciding with the pre-Covid high (at about 29,750) and tad below the June low. Oversold conditions on shorter-term charts coupled with a positive divergence (falling index associated with ascending momentum) on the weekly charts imply that the slide is losing steam, at least for now (see chart).
DJIA Daily Chart
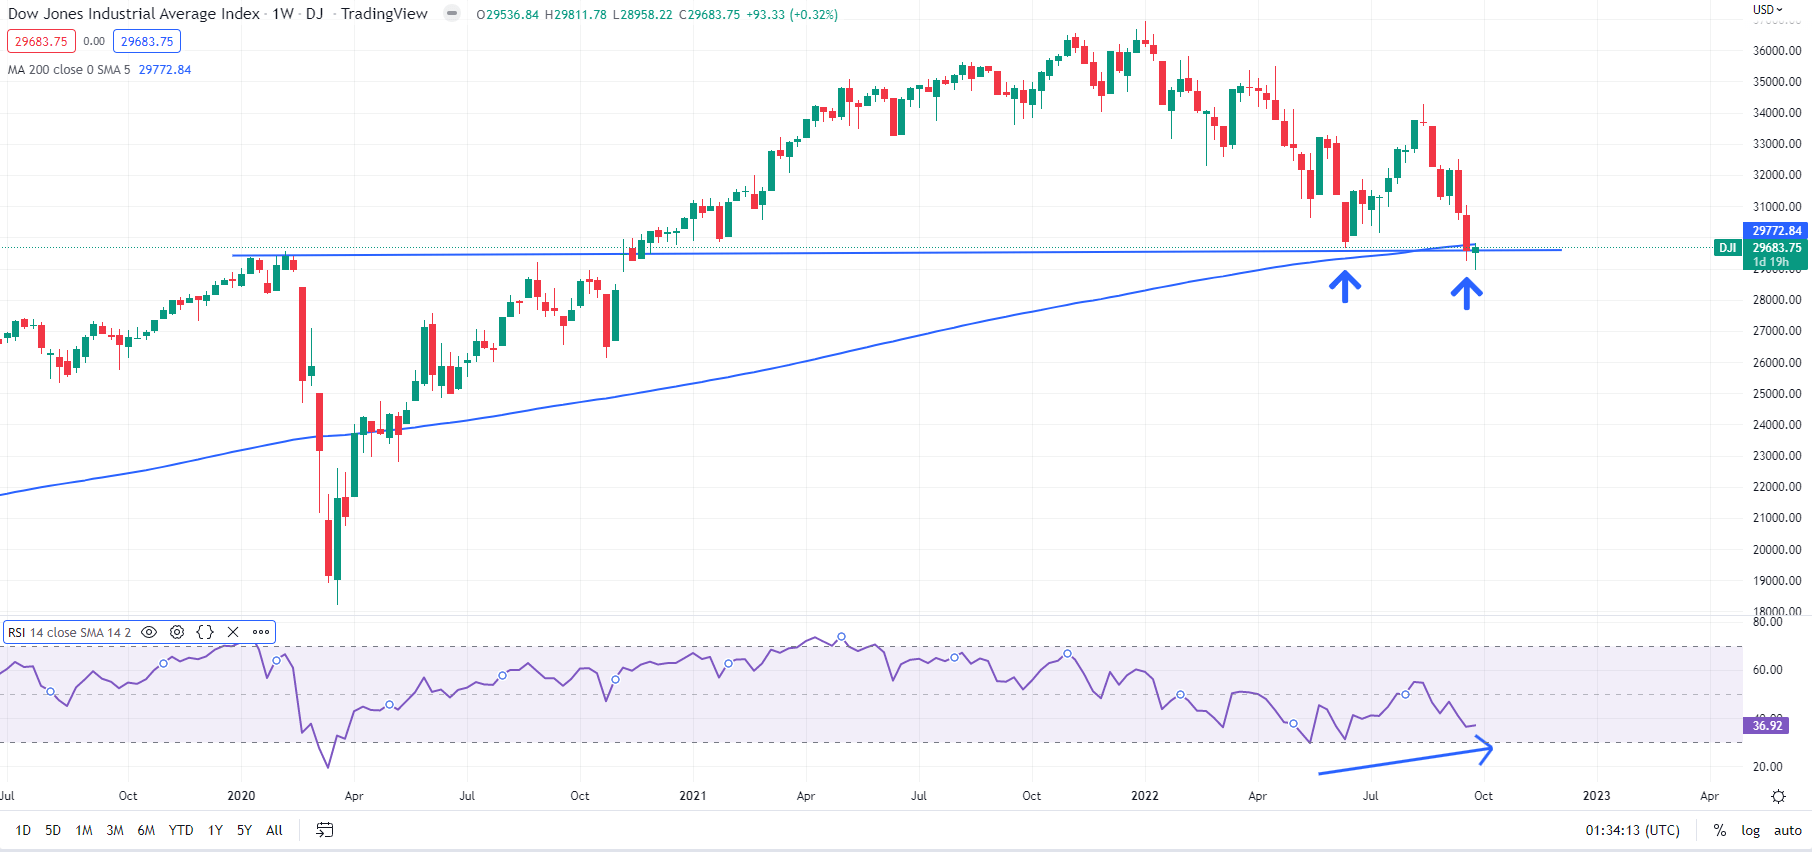
Chart Created Using TradingView
Moreover, a range of indicators suggests pessimism is running high in US equities. The CNN Fear & Greed index is at ‘Extreme Fear’ (19) versus Neutral (55) a month ago. The CBOE US put-call ratio earlier this week hit the highest level since the Covid-19 selloff in early 2020 – in a downtrend, due to higher demand put premiums trade expensive relative to calls.
US market breadth indicators also paint a similar story. Before Wednesday’s rebound, only 3% of the S&P 500 index stocks were trading above their respective 50-day moving average (DMA) and only 11% of them were trading above their 200-DMA. That echoes market conditions seen in June, before a short-term rally unfolded in US stocks (see chart). Moreover, market positioning is quite light. According to baseline estimates, CTAs, hedge funds and asset managers’ positioning is significantly short on net, while US household equity allocations have declined to 2018 levels.

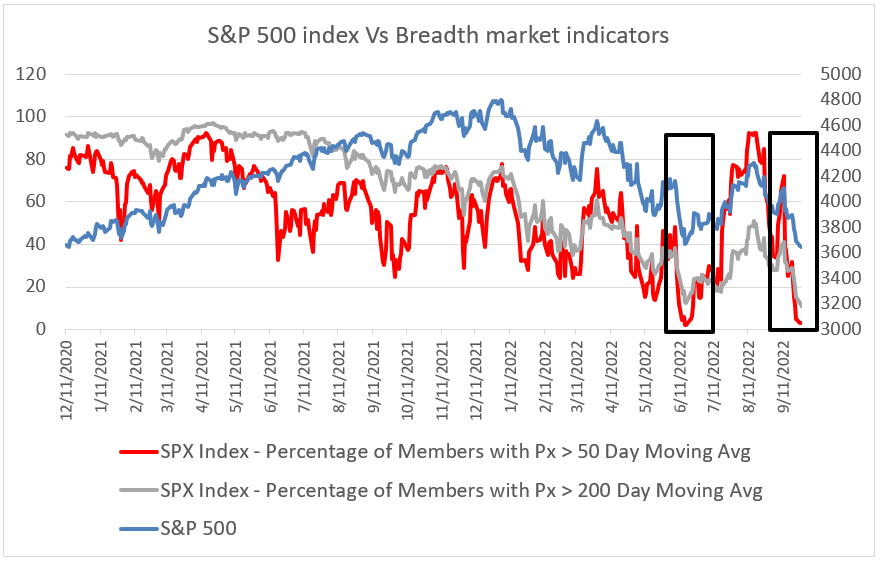
Source: Bloomberg, Chart Prepared by Manish Jaradi
The focus is now on the earnings season that kicks off in a couple of weeks. Given that 3Q earnings have been revised lower, the bar for upside surprises appears to be low, though guidance for 2023 will be key. In this regard, the record single-day slide earlier this month following preliminary results announcement and guidance pull by a multinational transportation and e-commerce company reflects that the scope for disappointment remains high.
A decisive break below converged support at about 29,750 could pave way towards the October 2020 low of 26,144. On the upside, there is plenty of resistance to cap any rebound, starting with the early-September low of 31,050, followed by the mid-September high of 32,500, with stronger resistance on the 200-DMA (now at about 33,275). The DJIA index needs to rise above solid resistance on the 200-DMA for the nine-month-long downward pressure to ease.

--- Written by Manish Jaradi, Strategist for DailyFX.com


