


DJIA, DOW JONES INDUSTRIAL AVERAGE, NASDAQ COMPOSITE INDEX, IXIC - Technical Outlook:
- DJIA’s slide appears to be losing steam
- Nasdaq Composite Index is around strong support
- Will Monday’s rebound continue and what are the key levels to watch?

Is Monday’s jump in US equities a sign of how the trend could be in the final quarter of the calendar year? Sentiment, positioning, seasonality, and oversold conditions indicate that the possibility remains high (pointed out last week). Still, the broader downtrend remains unchanged.
Pessimism is running high across markets. Despite last night’s spectacular rally, the CNN Fear & Greed Index continues to be in the ‘Extreme Fear’ zone (23 versus 16 early Monday). The CBOE US put-call ratio last month hit the highest level since the Covid-19 selloff in early 2020, before retreating in recent days. Puts tend to be favoured relative to calls at times when the fear level is high or when sentiment is pessimistic, making puts expensive relative to calls. This is also reflected in market positioning - according to market estimates CTAs, hedge funds and asset managers’ positioning is significantly short.
Stocks have been battered since the start of the year, with the DJIA down over 20% year-to-date even after Monday’s rebound, while the S&P 500 index has lost over 23% so far this year. As a result, only 10% of the stocks are above their respective 200-day moving averages (DMA) in the Dow Jones Industrial Average (DJIA) and only 15% of the stocks are above their respective 200-DMAs in the broader S&P 500 index. However, if history is any guide, the odds are high that stocks could recoup some of this year’s losses.
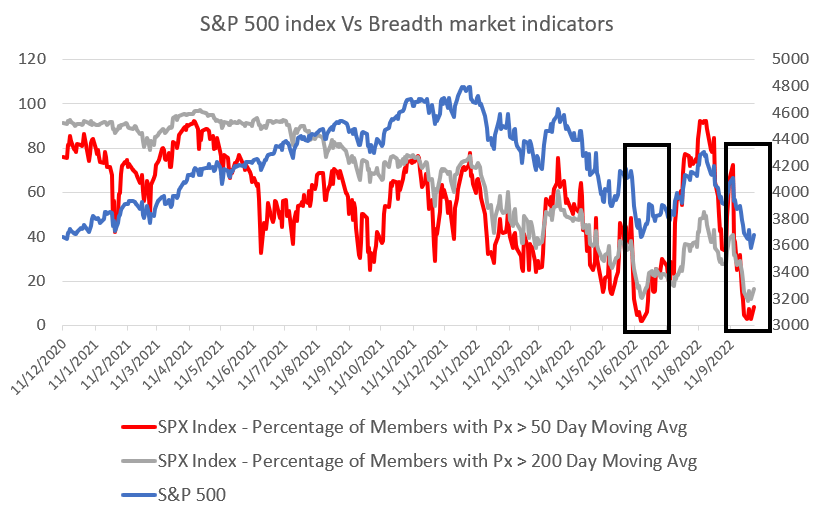
Data Source: Bloomberg, Chart Prepared by Manish Jaradi
In the past 20 years, the fourth quarter of a calendar year tends to be bullish for equity markets. On average, the Dow Jones Industrial Average (DJIA) has been up 1.38% in October, 1.99% in November and 1.0% in December, according to Bloomberg data. This comes as the US benchmark indices are holding around strong technical support.

DJIA SHORT-TERM TECHNICAL OUTLOOK - NEUTRAL
The DJIA has been struggling to break below key support at the June low of 29,650. A positive momentum divergence (falling index levels associated with rising momentum) on the daily and weekly charts suggests that the recent slide is losing steam in the short term (see chart). If the index manages to rise above last week’s high of 29,812, it will raise the prospect of some more gains in the interim. Subsequent resistance is at the early-September low of 31,050, followed by the mid-September high of 32,500. The medium-term downtrend is unlikely to change while the index holds below the 200-DMA (now at about 33,175).
DJIA Daily Chart
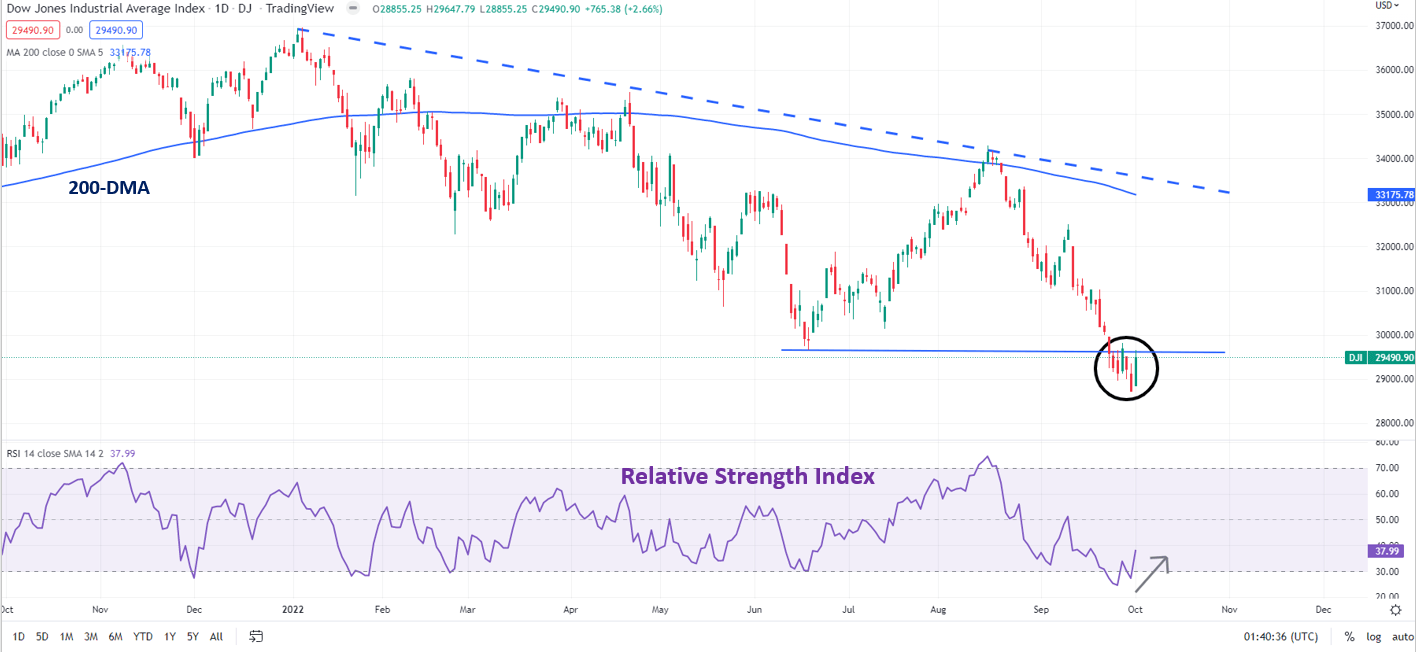
Chart Created Using TradingView
NASDAQ COMPOSITE INDEX SHORT-TERM TECHNICAL OUTLOOK - NEUTRAL
Similar to DJIA, the Nasdaq Composite Index is testing major converged support – the June low of 10,565, the pre-Covid high of 9,840 and the 200-week moving average. Given the significance of the support level, the prospect of at least a short-term pause in its slide remains high, especially as bears, while dominant, appear to be losing control (see chart). Even if last night’s rebound follows through, it wouldn’t necessarily imply the worst is over. For the Nasdaq Composite Index, the 200-DMA, coinciding with the August high of 13,180 high, remain tough resistance for the index to crack.
NASDAQ COMPOSITE INDEX Weekly Chart
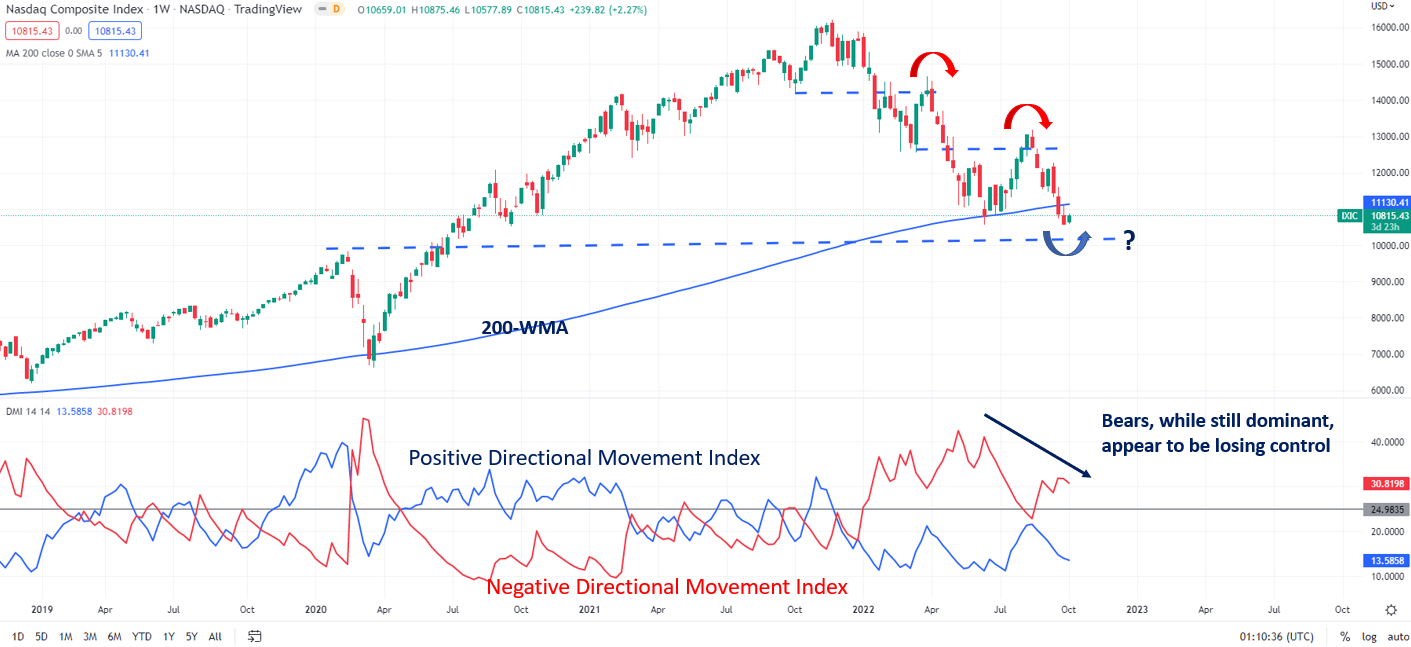
Chart Created Using TradingView

--- Written by Manish Jaradi, Strategist for DailyFX.com


