


Gold, XAU/USD, Crude Oil, WTI – Commodities Technical Analysis:
- Crude oil prices continue trading lower within a Falling Wedge pattern
- Gold prices may be readying to reverse lower, but confirmation lacking
- XAU/USD is eyeing RSI divergence, Rising Wedge and an Evening Star

Crude Oil Technical Analysis
Crude oil prices are trading within a Falling Wedge chart formation. The latter is a bullish reversal pattern, but prices need to break above it to begin placing the focus back to the upside. Until then, the focus remains tilted lower as WTI continues to consolidate lower within the boundaries of the Falling Wedge.
Key support appears to be the 71.13 – 70.10 support zone, as well as the floor of the wedge. Breaking under this range would open the door to downtrend resumption, placing the focus on lows from May 2021 around 61.69 - 65.60. Otherwise, pushing above the chart formation would offer an increasingly bullish prospect. That subsequently opens the door to testing the 100-day SMA. The latter held in November, reinstating the downside focus.
WTI Daily Chart
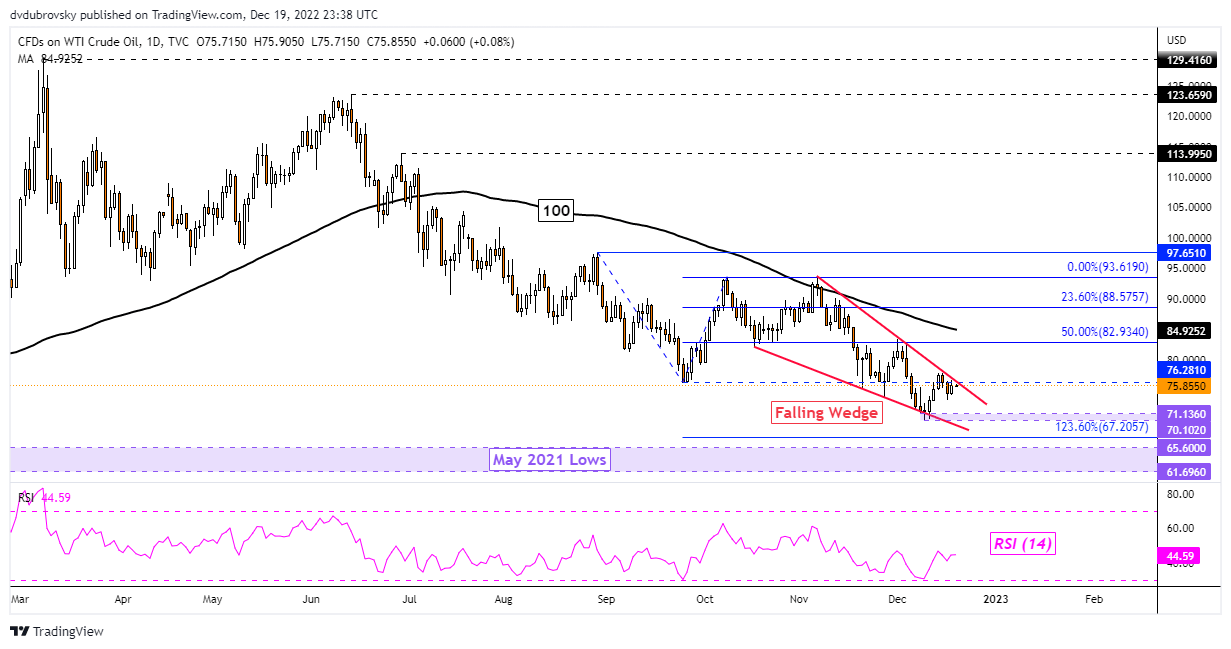
Chart Created in TradingView
Gold Technical Analysis
Meanwhile, gold prices may be readying to reverse the near-term uptrend since November. XAU/USD broke under a bearish Rising Wedge after negative RSI divergence emerged. The latter shows fading upside momentum, which can precede a turn lower. Prices also left behind a bearish Evening Star candlestick pattern. While these occurrences hint that a reversal lower could be in the cards, follow-through has been lackluster.
XAU/USD has been idling just above the key 23.6% Fibonacci retracement level at 1775, establishing it as key near-term support. Falling under the latter would confirm the increasingly bearish signals highlighted earlier, exposing the 50-day Simple Moving Average (SMA). The latter may hold, reinstating the near-term upside bias. Otherwise, pushing above 1824 would shift the focus back towards uptrend resumption and the June high of 1879.

XAU/USD Daily Chart
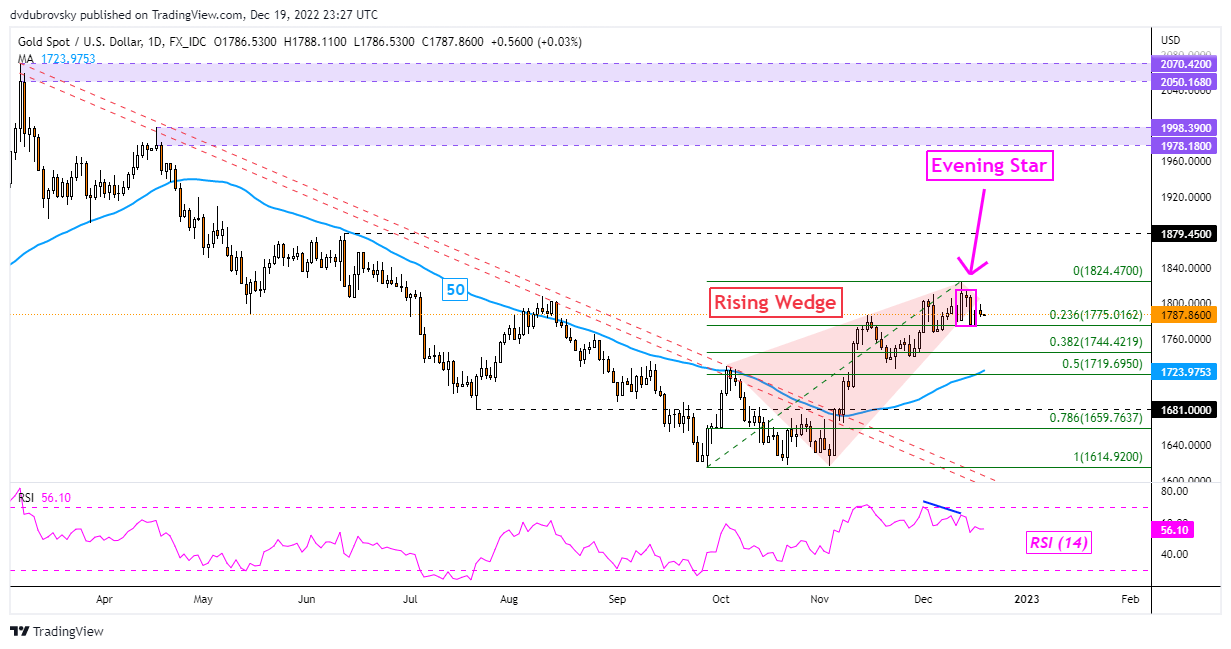
Chart Created in TradingView
--- Written by Daniel Dubrovsky, Senior Strategist for DailyFX.com
To contact Daniel, follow him on Twitter:@ddubrovskyFX


