


British Pound, GBP/USD, EUR/GBP – Technical Update:
- British Pound analyzed against USD and EUR
- GBP/USD bearish Head & Shoulder in focus
- EUR/GBP facing the 100-day moving average

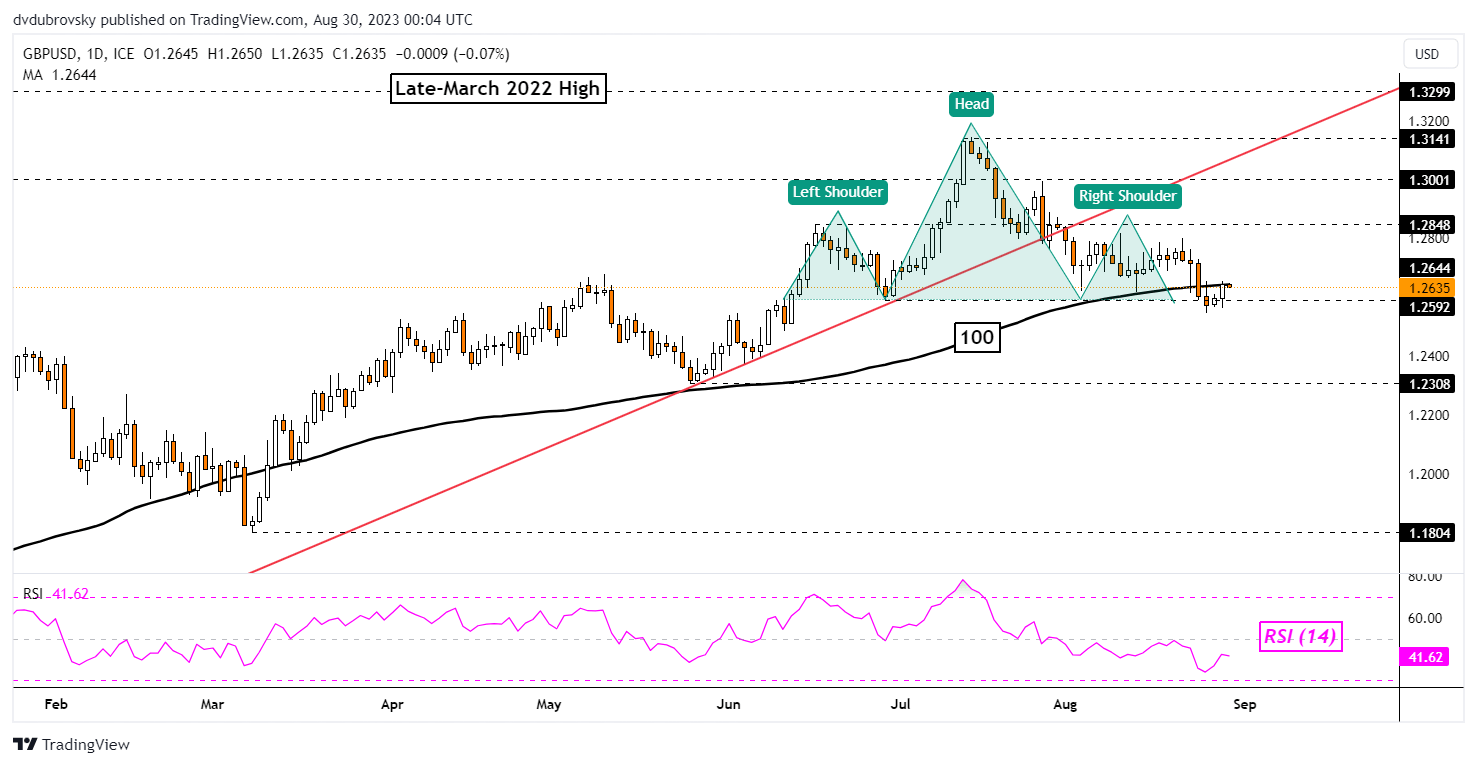
The British Pound continues to be overshadowed by a brewing bearish Head & Shoulders chart formation against the US Dollar. On the daily chart below, GBP/USD can be seen struggling to clear the neckline around 1.2592. Furthermore, prices are struggling to find follow-through after breaking under the 100-day Moving Average (MA).
Confirming a drop through 1.2592 opens the door to extending lower, placing Sterling at risk. That exposes the May low of 1.2308 as key support below. Otherwise, turning higher places the focus on the left shoulder inflection point of 1.2848. Extending gains beyond that may open the door to revisiting the July high of 1.3299.

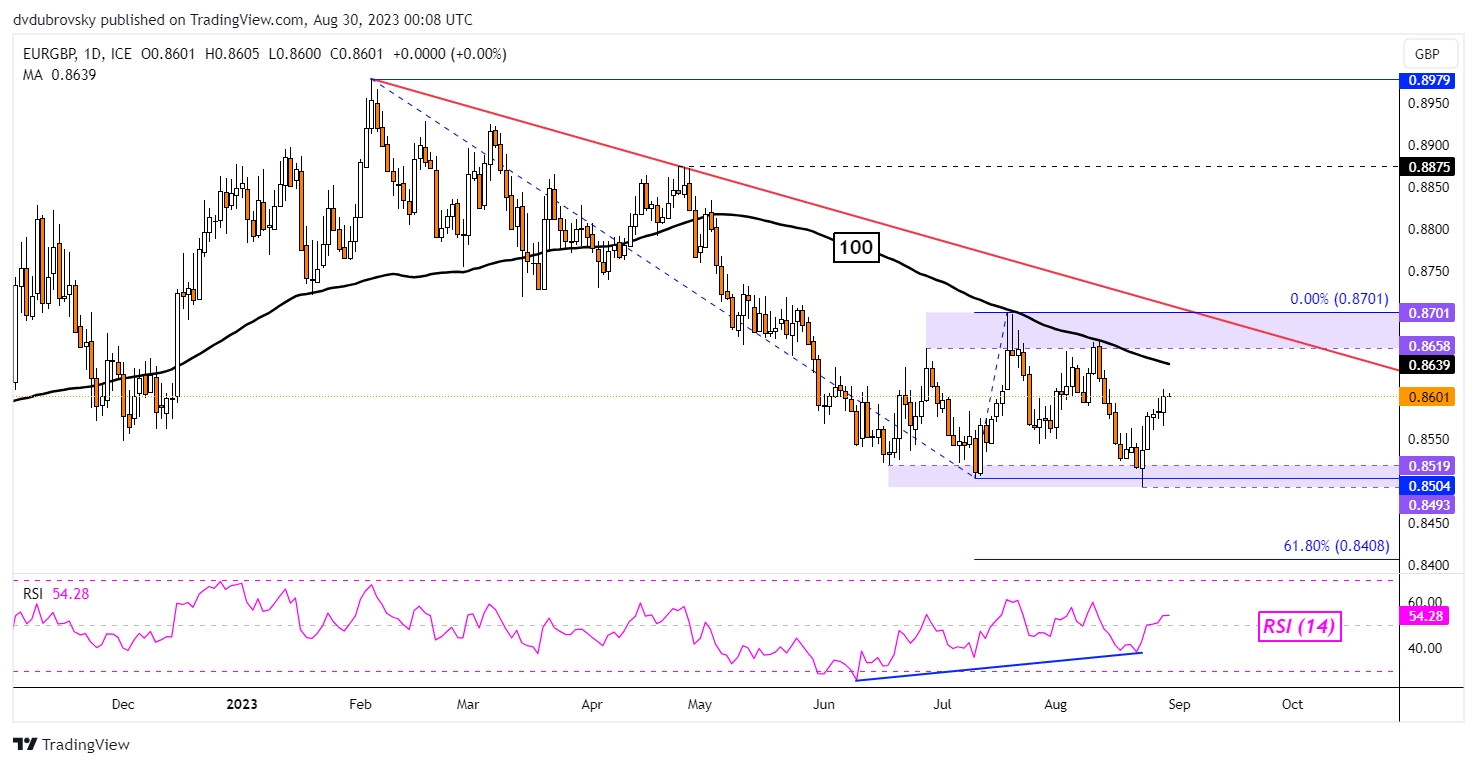
Meanwhile, it is a different story against the Euro. Here, the British Pound is in a fairly neutral setting. EUR/GBP can be seen consolidating between 2 key ranges of support and resistance. The former seems to be around the 0.8493 – 0.8519 area while the latter is between 0.8652 – 0.8701. The recent bounce off support followed persistent positive RSI divergence.
This is typically a sign of fading downside momentum which can at times precede reversals. Now, the focus is shifting to the 100-day Moving Average. This line has held as resistance earlier this year, maintaining the broader downside focus. Another rejection could open the door to turning lower, placing the focus on the August swing lower. Otherwise, pushing higher places the focus on the zone of resistance.

--- Written by Daniel Dubrovsky, Senior Strategist for DailyFX.com


