


Talking Points:
- Traders should look to match the strategy being traded to the prevailing market condition.
- Traders can use multiple time frame analysis to get a ‘bigger picture’ look at a market’s condition
- We include tips and sample trend, range, and breakout-related strategies
There are many different ways to embark upon the art of speculation.
Technical Analysis takes on key importance in the currency market; where leverage allows traders to greatly amplify the gains or losses of the underlying currency pair. Technical Analysis can help traders diagnose the prevailing trend (if there is any), identify support and resistance levels, and institute risk management strategies.
In this article, we’re going to delve into the topic of technical trading strategies.
Go With the Flow – Match the Strategy to the Condition
In The Life Cycle of Markets, we showed you how markets will generally display one of three primary market conditions.
The Life Cycle of Markets

Created with Marketscope/Trading Station II; prepared by James Stanley
Each of these three conditions varies greatly in how prices will move, and traders are often best-served by matching the appropriate strategy with the prevailing condition.
In the article How to Direct Your Strategy Based on Market Condition, we taught traders how they can use a combination of multiple time frame analysis, and an indicator like ADX to help determine the ‘bigger picture’ market condition.
Traders can use the longer-term chart to determine the type of strategy to utilize given the ‘bigger picture,’ of a particular market. And the shorter time frame can be used to implement and execute the strategy.
Trends
Trends will show up when there is a bias in the marketplace. And trends will rarely form in a straight-line up or down on the chart; more normally a trend will show as a series of ‘higher-highs’ and ‘higher-lows,’ on the chart (in the case of an up-trend); or ‘lower-lows,’ and ‘lower-highs,’ in the case of a down-trend.
Traders should look to buy up-trends cheaply, and sell down-trends expensively
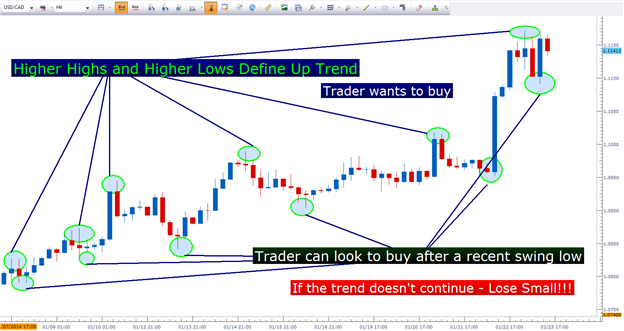
Image taken from Using Price Action to Trade Trends
We covered the topic of trading trends in the article, How to Build and Trade a Trend-Following Strategy. The goal of the trader when trading with a trend is to buy up-trends cheaply, while selling down-trends expensively. What constitutes ‘cheap’ or ‘expensive’ is what varies from trend-strategy to trend-strategy.
Traders can trade trends using price and price alone, and we discussed this premise in the article, Using Price Action to Trade Trends. Or, if traders want to introduce an indicator to make the timing of the entry more objective, Price Action can be used to read the trend on the longer time frame chart, and an indicator like RSI can be used to trigger positions in the direction of that trend. We discussed this type of strategy in-depth in the article, Price Action with RSI.
Traders can also look to trade trends without price action, and/or on very short time frames. An example of a strategy that looks to do just that is outlined in the article, Short-Term Momentum Scalping in the Forex Market; in which I share my ‘fingertrap’ trading strategy.
Ranges
Eventually, the bias in the market that created the trend will cease to push prices higher (or lower in the case of down-trends). This is where range-bound market conditions come into play, and this condition is often highlighted by congestion or consolidation in the chart.
We discussed trading in this type of condition in the article, How to Trade Ranges.
Entries in a range-bound market environment are similar to trading in trends: Traders should look to ‘buy low,’ and ‘sell high.’
Price action can be a key way of looking to trade in range-bound market conditions, and we discussed that in the article, How to Analyze and Trade Ranges with Price Action. Alternatively, traders can look to incorporate an indicator-based trigger into their strategy such as what Walker England outlined in the article, A Simple Strategy for Ranging Markets. Or, if you’d prefer to look at an entirely indicator-based strategy, the article When the Market Gives Ranges, Trade Ranges covers such a strategy.
The notable difference between a trend and a range, however, is the fact that profit potential in a range-based strategy may be capped.
Profit Potential in a Range may be capped (resistance for longs, support for shorts)

Image taken from How to Analyze and Trade Ranges with Price Action
After all, if a trader is buying in a range, they are likely looking to take price to resistance for their profit target. Since the profit potential is often capped in a range-trading strategy, some traders will rather wait for the range to be broken, which leads us to our next market condition…
The Breakout
The most exciting market condition is also one of the most dangerous. Trading breakouts is the exact opposite of trading in a range-bound market condition. Whereas traders want to look to buy support and sell resistance in a range-bound environment; breakout traders are waiting for the inevitable break of the range by buying breaks of resistance, or selling breaks of support.
Breakouts can be fun to trade because price movements can be so fast and voluminous, but they can also be very costly. We discussed this condition in-depth in the article, Trading the Break. The ranges mentioned above will eventually be broken: Maybe it’s a news announcement, or a data print, or a central banker giving ‘off-the-cuff’ commentary; whatever the reason, ranges get broken by fast price movements that may extend for a while.
Making matters more difficult is that these breakouts bring extraneous volatility that can see quick reversals that can massively deplete a trader’s equity. We tackled the concept of trading breakouts in more depth in the article The Ballistics of Breakouts.
Traders can use price action to identify support or resistance levels to look at or for when instituting breakout-related strategies. We outlined such an approach in the article, Price Action Breakouts. Traders can also look to incorporate support and resistance from a variety of technical mechanisms to find desirable levels to enter positions.
Fibonacci, Pivot Points, and Psychological Whole Numbers are all forms of support and resistance identification that can be utilized in breakout strategies.
The key aspect of trading breakouts is risk-reward ratios. Because false breakouts can occur so frequently during these volatile periods in the market, traders should look to mitigate the damage when wrong while maximizing profit when right in an effort to avoid The Number One Mistake that Forex Traders Make.
-- Written by James Stanley
James is available on Twitter @JStanleyFX
To join James Stanley’s distribution list, please click here.
Would you like to enhance your FX Education? DailyFX has recently launched DailyFX University; which is completely free to any and all traders!
We’ve recently begun to record a series of Forex Videos on a variety of topics. We’d greatly appreciate any feedback or input you might be able to offer on these Forex videos:


